Alerts
Alerts are the security and policy events EndpointOps raises across your fleet- things like a risky process, a failed check, or a match against a threat feed. This screen is where you review them, filter by what matters, and dig into the threat behind each one.
How to get here
You need View Alerts permission.
- Sign in to EndpointOps.
- In the left sidebar, click Alerts.
- Or click the notifications bell in the top-right header and choose a severity- it opens Alerts filtered to that severity.
Navigate to: Alerts
URL path: /alerts (for example, https://your-endpointops-site/alerts). You
can deep-link to a severity, e.g. /alerts?severity=Critical.
The Alerts screen
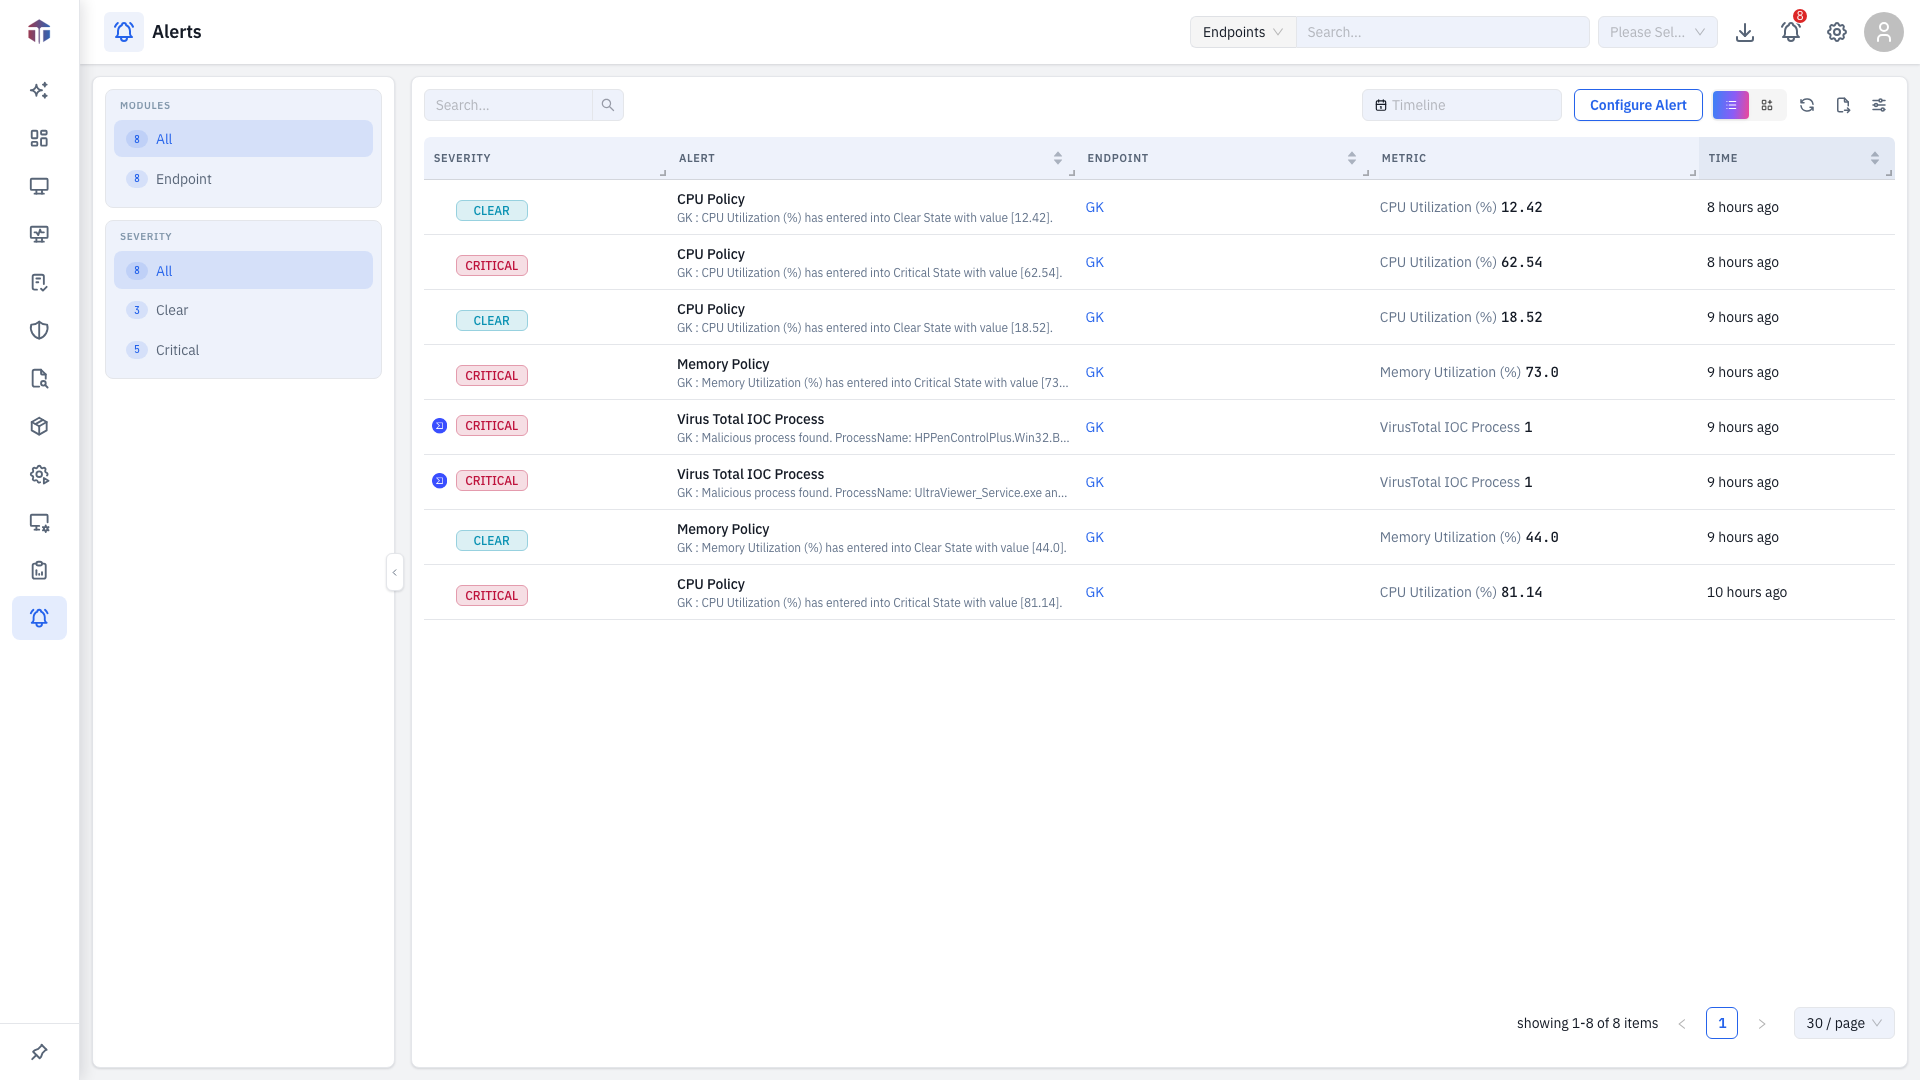
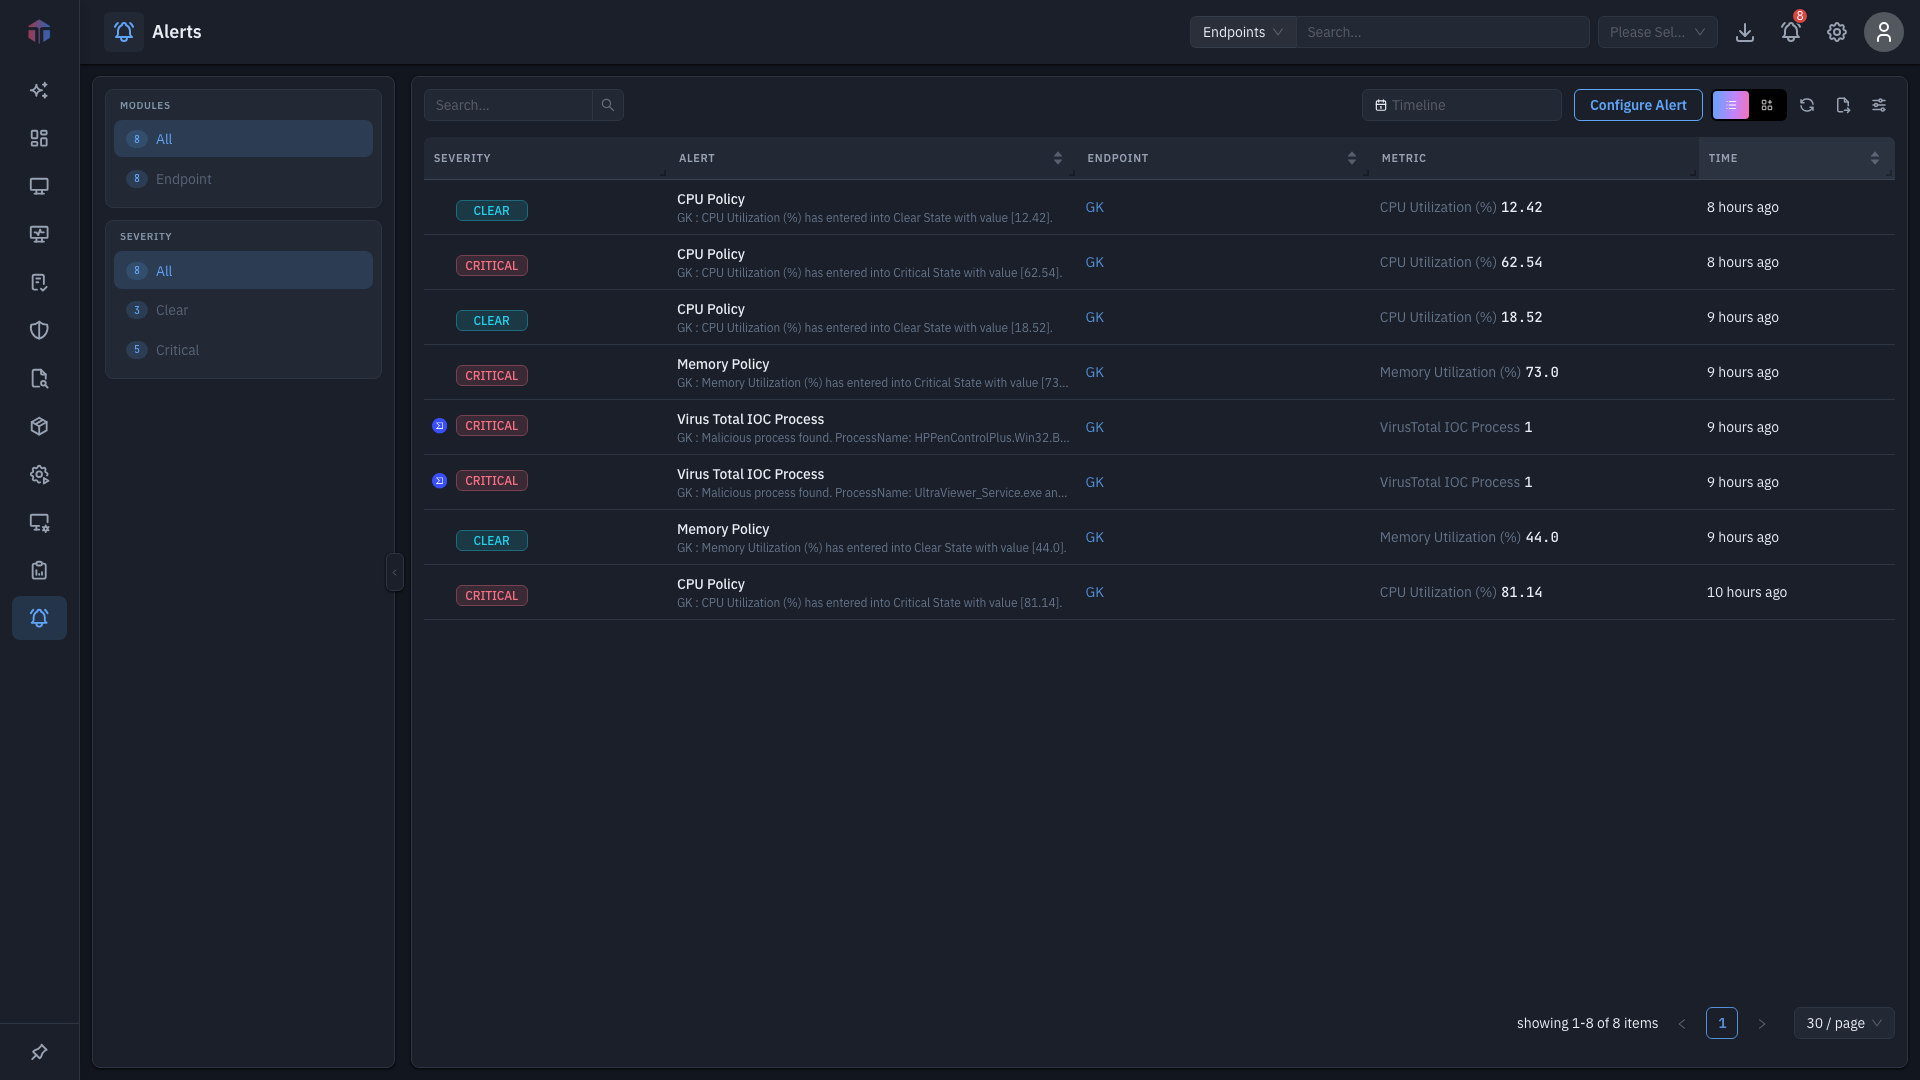
The screen has a filter pane on the left and the alert table on the right.
Filter pane (left)
- Modules- filter by the feature that raised the alert (each shows a count).
- Severity- All, Critical, High, Medium, Low, or Clear (each shows a count; only severities that currently have alerts appear).
Alert table (right)
| Column | What it shows |
|---|---|
| (threat) | A threat-context icon at the far left, shown on alerts that matched a threat feed. Click it to open threat intelligence (see below). |
| Severity | A colour-coded tag- Critical, High, Medium, Low, or Clear (the condition has since cleared). |
| Alert | The alert name, with a fuller message beneath it. |
| Endpoint | The affected machine. Click it to open that endpoint's detail. |
| Metric | The attribute and the value that triggered the alert (for example CPU Utilization (%) 62.54). |
| Time | How long ago the alert was raised (for example 8 hours ago). |
Above the table you can:
- Search the alerts- matches the alert name, endpoint, severity, module, attribute, value, and message.
- Set a time range with the timeline picker to scope alerts to a period.
- Configure Alert- jump to policy settings to change which conditions raise alerts.
- Switch the view with the toggle on the right: list (the table) or card (a grid of alert cards showing the same fields in a tile per alert).
How do I investigate an alert's threat?
Some alerts carry threat intelligence- a reputation lookup for the IP, file, or domain involved.
- Click the threat-context icon at the start of the alert's row. The icon only appears on alerts that matched a threat feed; rows without a match show no icon.
- A drawer opens with the findings. Depending on the source, you'll see an AbuseIPDB report (IP reputation) or a VirusTotal report (file/URL/domain reputation).
- Click Refresh in the drawer to re-run the lookup for the latest verdict.
How do I see alerts from the header?
The notifications bell in the header carries a red badge with the open-alert count and is available on every screen- so you can reach Alerts from the header bell or the left sidebar menu, whichever is closer.
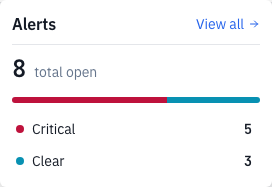
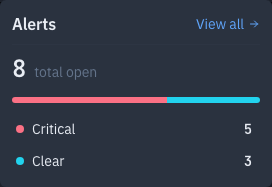
Click it to see Total Alerts plus a per-severity breakdown. Click Total Alerts to open the full list, or a severity to open Alerts filtered to it.
How do I change which conditions raise alerts?
Click Configure Alert on the Alerts screen. It takes you to Settings → Policy Management, where you define the rules that generate alerts. See Alert Configurations.
Tips & troubleshooting
- No alerts show. Widen the timeline range, set Severity to All, and clear any Module filter. If there are genuinely none, nothing has triggered for the current scope.
- The threat icon does nothing for some rows. Only alerts with an external threat-intelligence match carry threat context; others have nothing to look up.
- An alert keeps coming back. It will recur until the underlying condition is fixed on the endpoint, or you adjust the rule under Alert Configurations.
- I can't open the screen. It needs View Alerts permission. Ask your administrator.
Related
- Alert Configurations- define which conditions raise alerts.
- Endpoints- open the machine an alert points to; each endpoint also has its own Alert tab.
- Dashboard- alert summaries at a fleet level.