Dashboard
The Dashboard is your home screen. It shows your fleet at a glance through a grid of widgets- charts and counters such as endpoint health, vulnerabilities, patch status, and compliance. You can keep several dashboards, switch between them, and build your own.
How to get here
You need View Dashboard permission. The dashboard is where you land right after signing in.
- Sign in to EndpointOps. You arrive on your default dashboard.
- From any other screen, click Dashboard (the grid icon) at the top of the left sidebar to come back.
Navigate to: Dashboard
URL path: /dashboard (for example,
https://your-endpointops-site/dashboard). EndpointOps then sends you to your
default dashboard at /dashboard/{id}.
The Dashboard screen
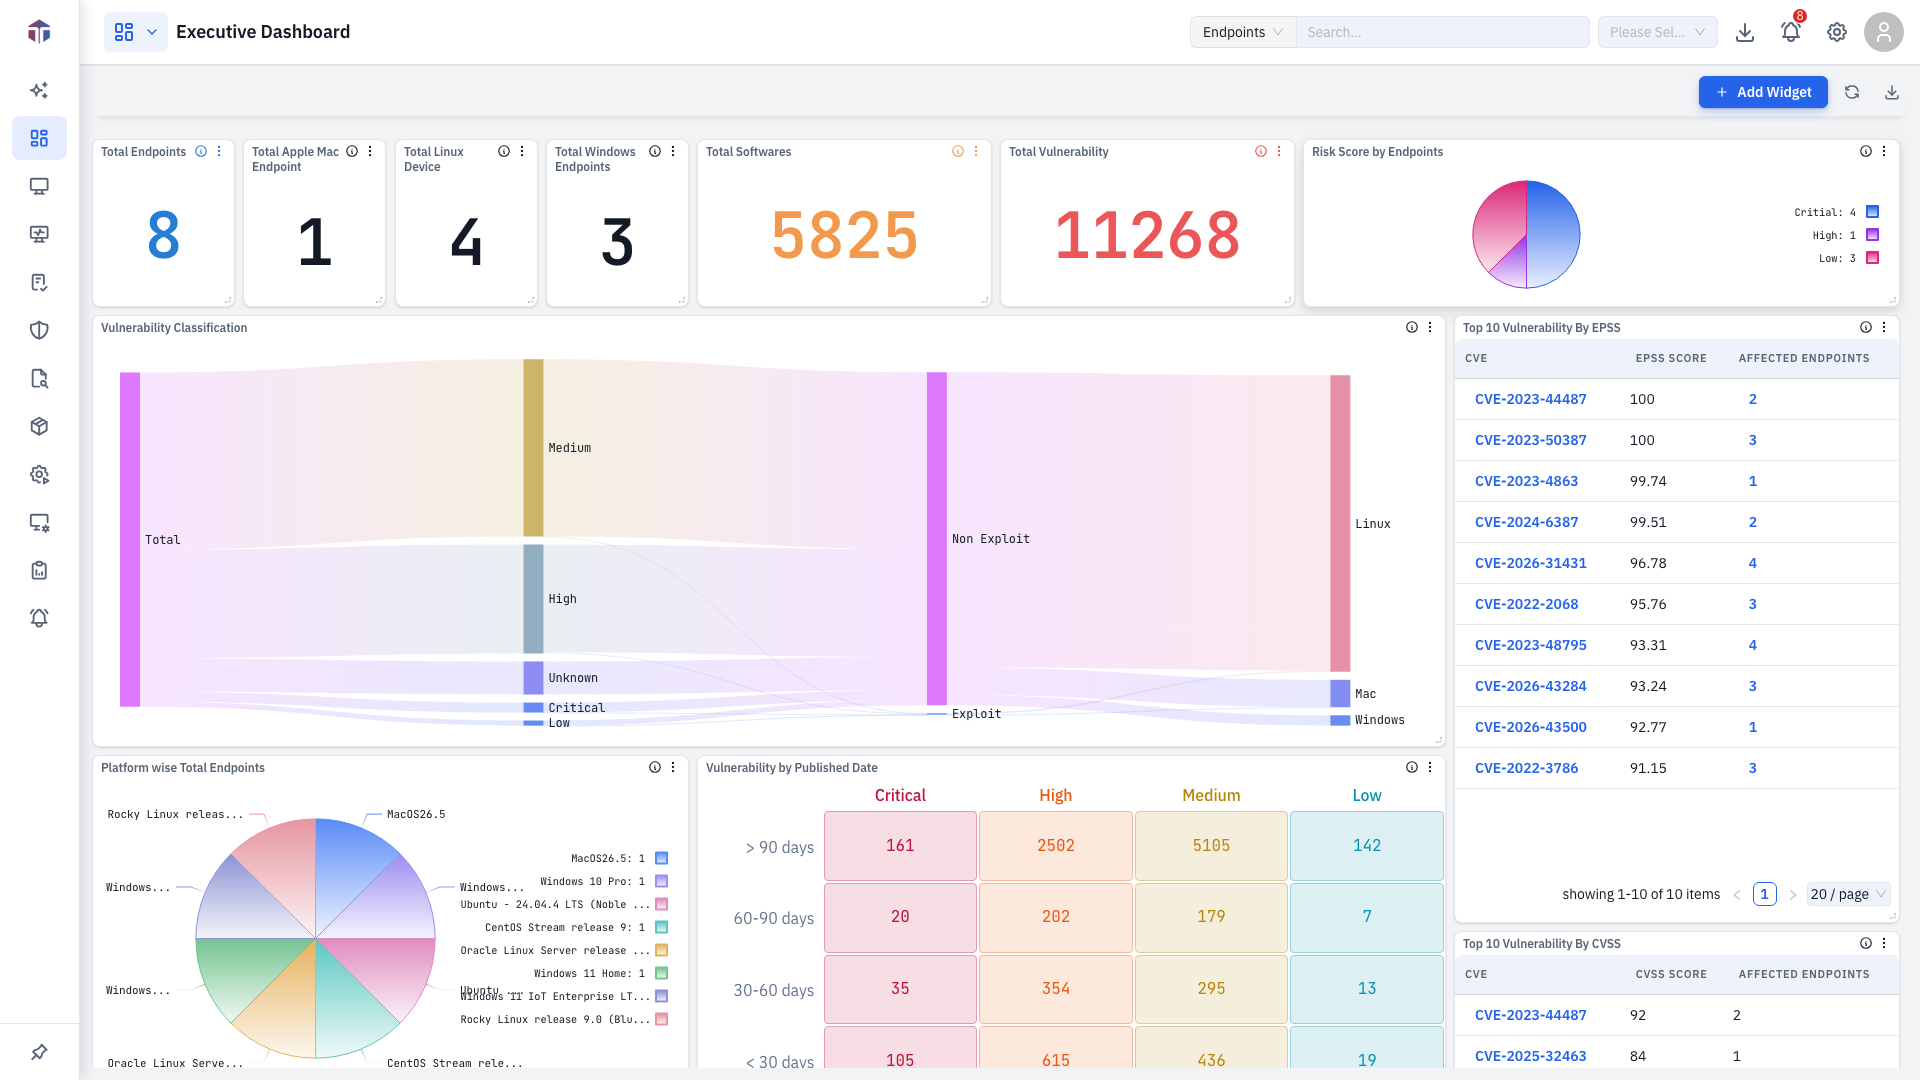
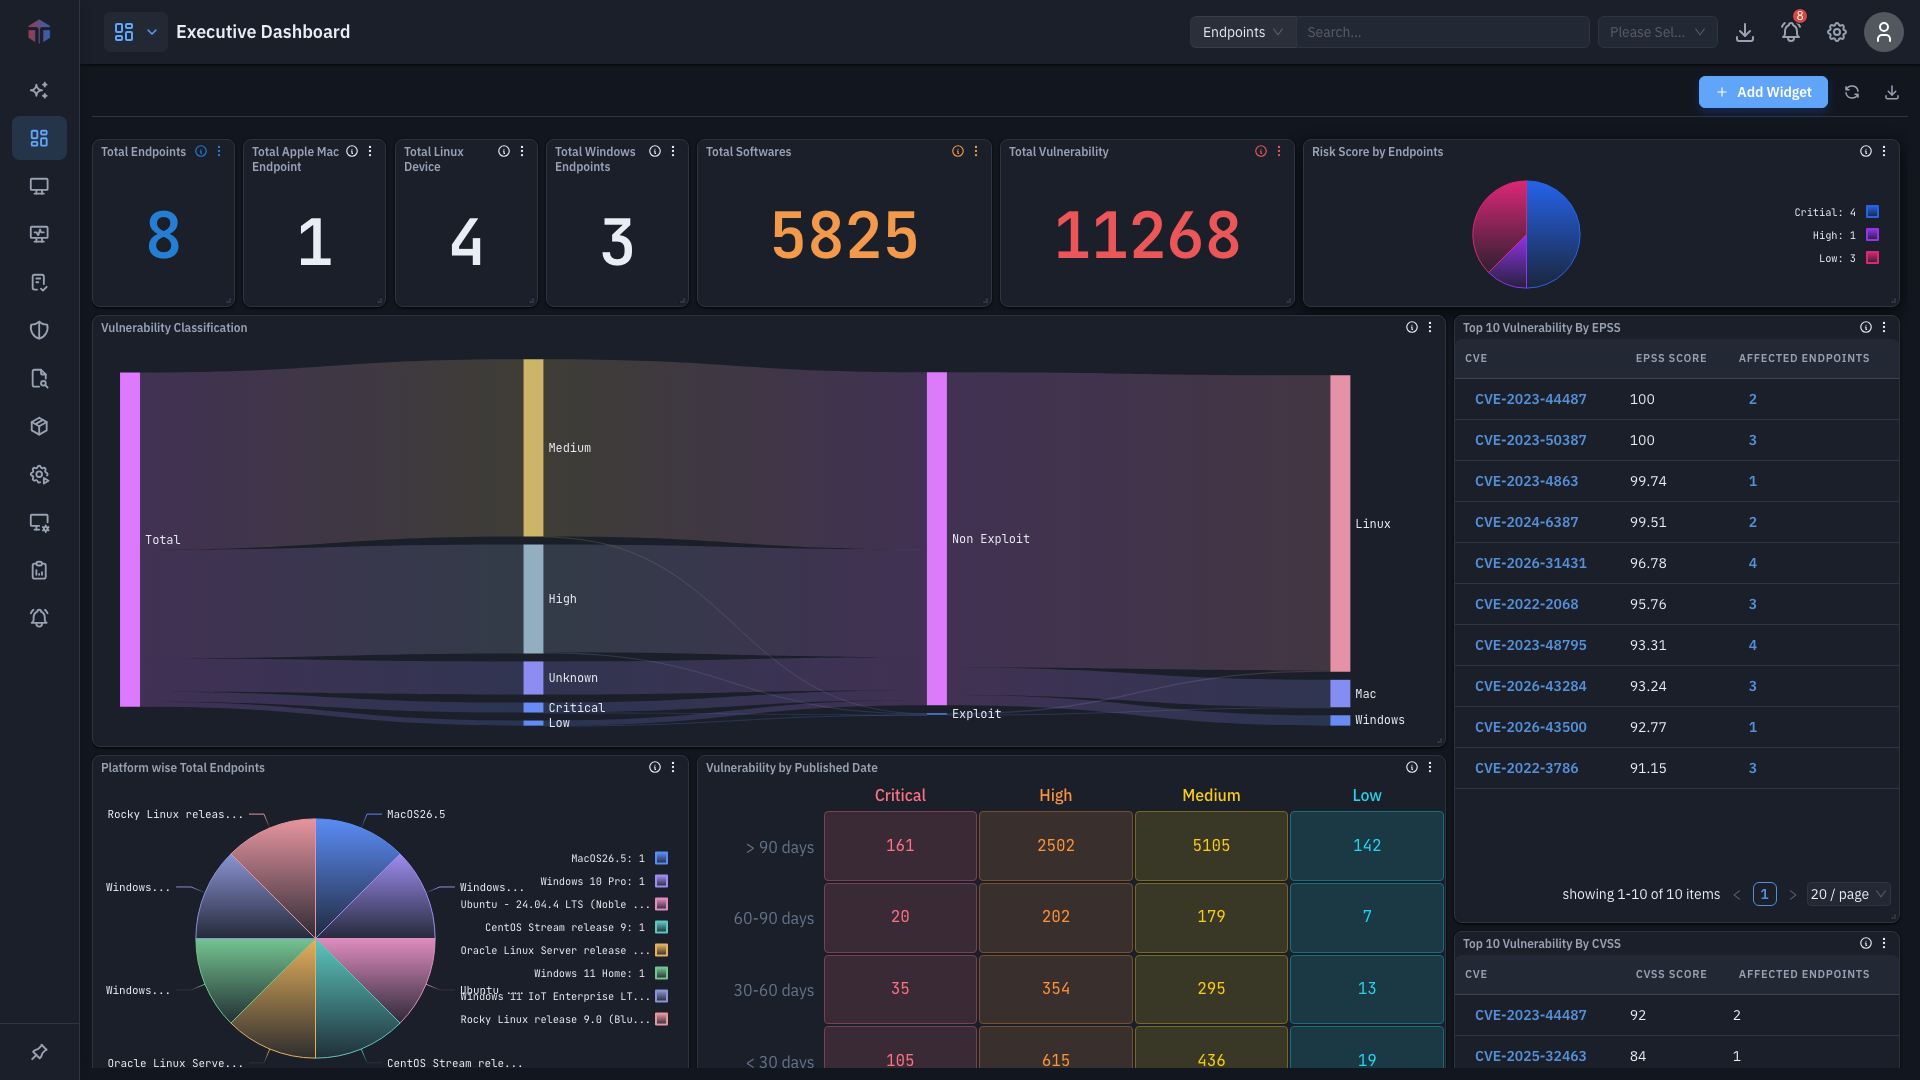
| # | Area | What it does |
|---|---|---|
| 1 | Dashboard selector | The dashboard (grid) icon with a chevron, just left of the dashboard title. Click it to switch dashboards, mark favourites, set a default, or create a new one. |
| 2 | Add Widget | Opens a panel of widgets you can add to this dashboard. Shown only if your role allows it. |
| 3 | Refresh | Reloads every widget with the latest data. |
| 4 | Export (download icon) | Saves the current dashboard as an image. |
| 5 | Widget grid | The widgets themselves. Drag a widget to move it, drag its corner to resize; the layout is saved automatically. |
How do I switch between dashboards?
-
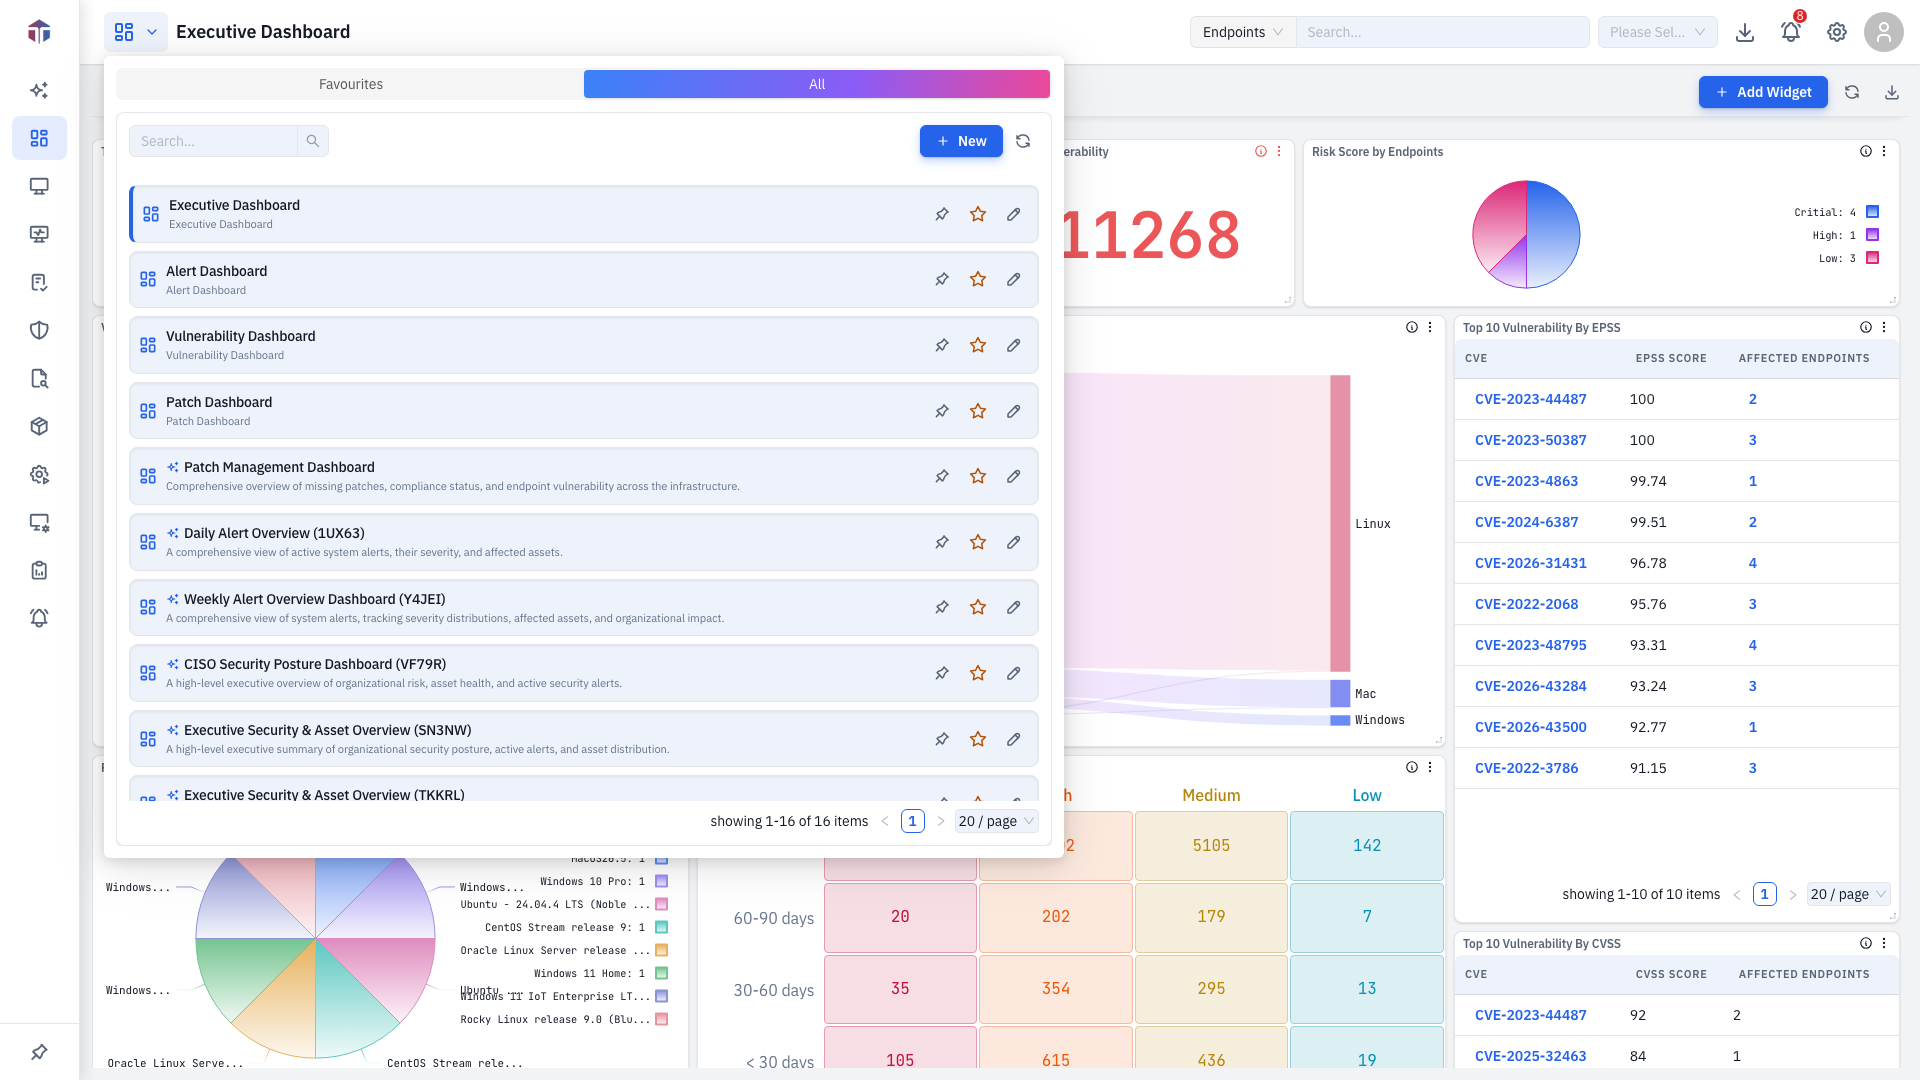
Click the dashboard selector (the title with the chevron, top-left).
-
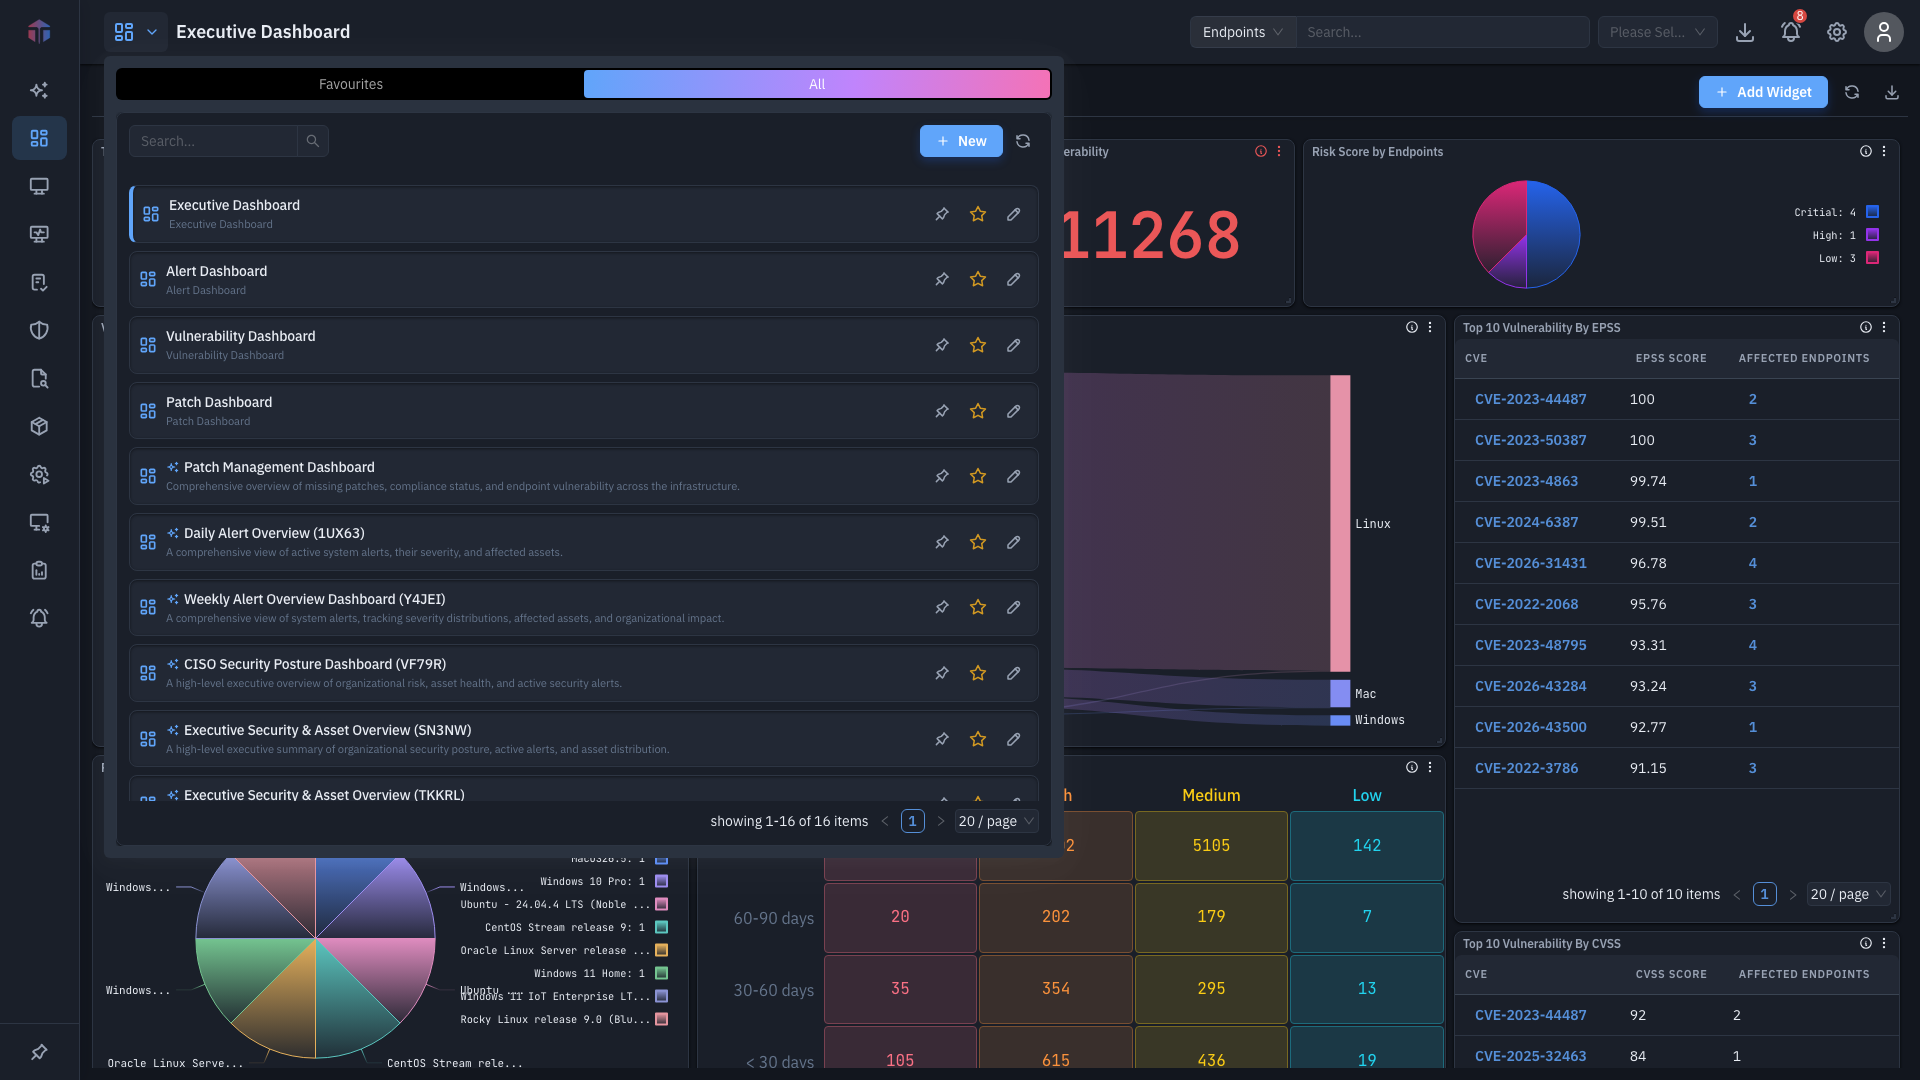
The selector opens with a Favourites / All toggle:
- Favourites- dashboards you've starred.
- All- every dashboard you can see.
-
Click any dashboard in the list to open it.
Every row has three quick actions on the right:
- Set as default (pin)- makes that dashboard the one you land on at sign-in. The current default shows a filled pin and the tooltip Default dashboard.
- Favourite (star)- adds or removes the dashboard from Favourites. Click once to star it; click again to remove it.
- Edit (pencil)- rename the dashboard or change its description (needs Update Dashboard permission).
Star the dashboards you use most. The selector keeps them under the Favourites tab and- once you have at least one favourite- opens on that tab by default, so your go-to dashboards are one click away instead of buried in the full list.
A dashboard created by GAS AI shows the GAS AI icon next to its name. It behaves like any other dashboard- you can favourite it, set it as default, or edit it.
How do I create a dashboard?
-
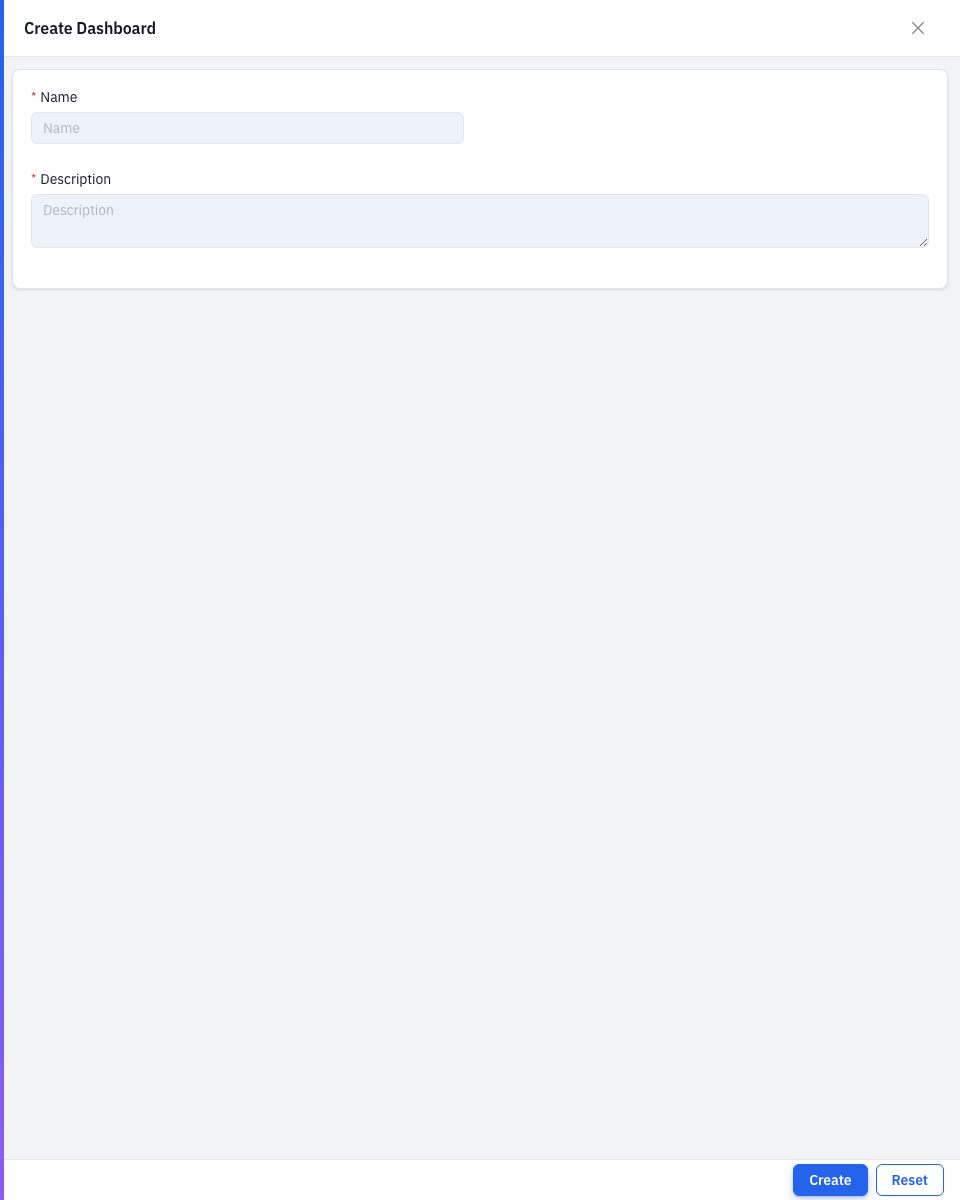
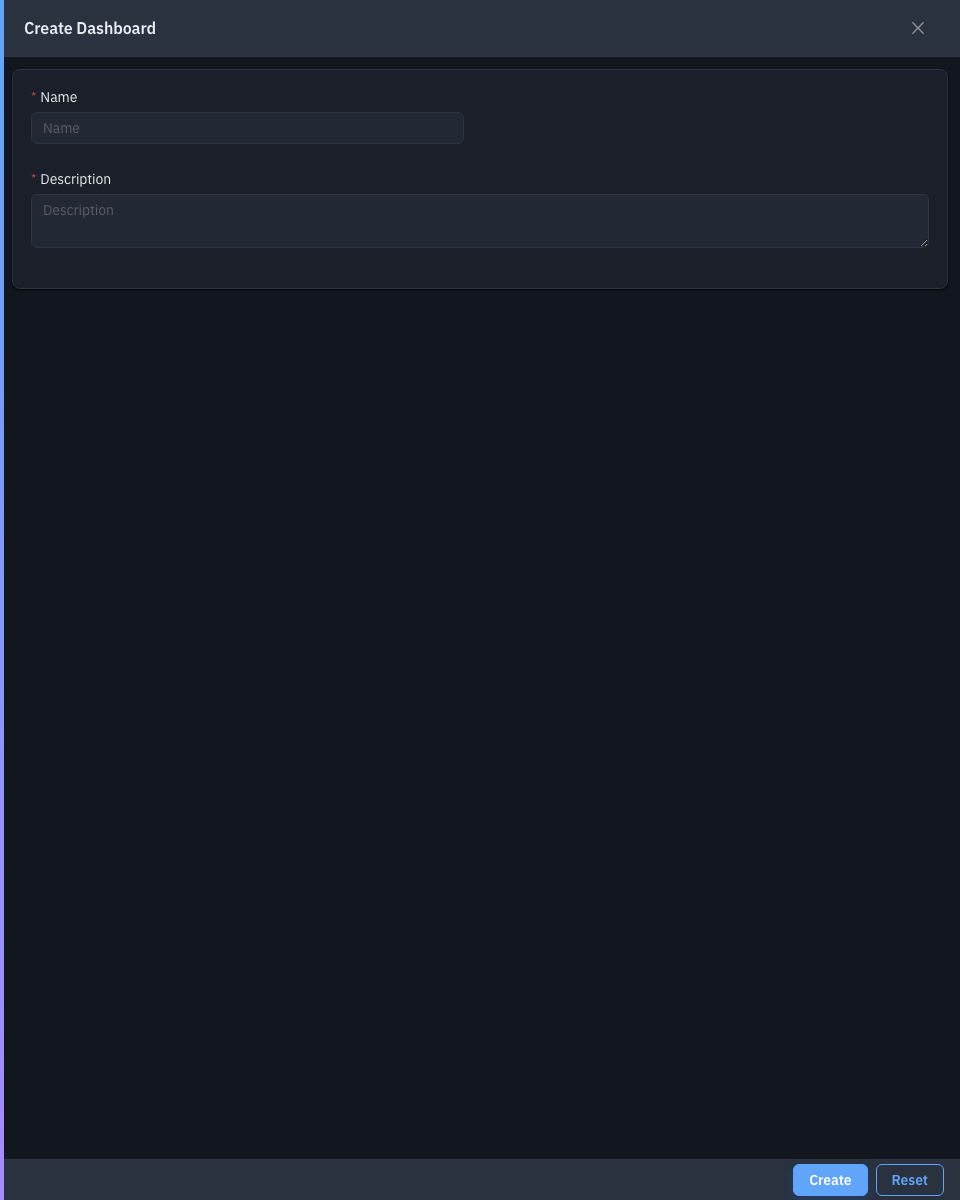
Open the dashboard selector and click New. The Create Dashboard form opens.
-
Fill in the form (red asterisk = required):
Field Required Notes Name Yes The dashboard's title, shown in the selector and the header. Description Yes A short note on what the dashboard is for. -
Click Create. The new dashboard opens empty- add widgets to it next. Reset clears the form.
How do I add or edit a widget?
Adding widgets needs Update Dashboard + View Widget permission; building a new one needs Create Widget.
Step 1- Open the Add Widgets panel
Click Add Widget. The Add Widgets panel slides in from the right and leaves the dashboard visible, so you can drop widgets straight onto it.
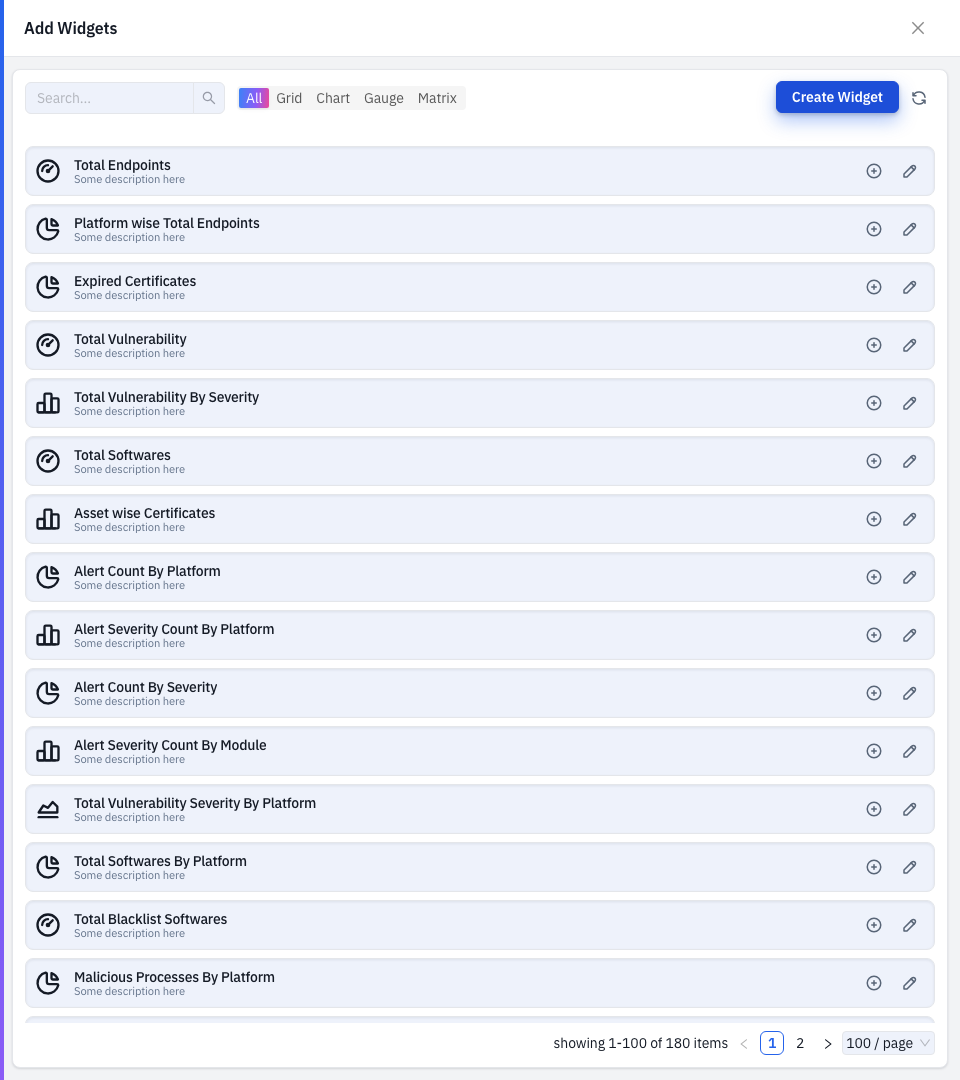
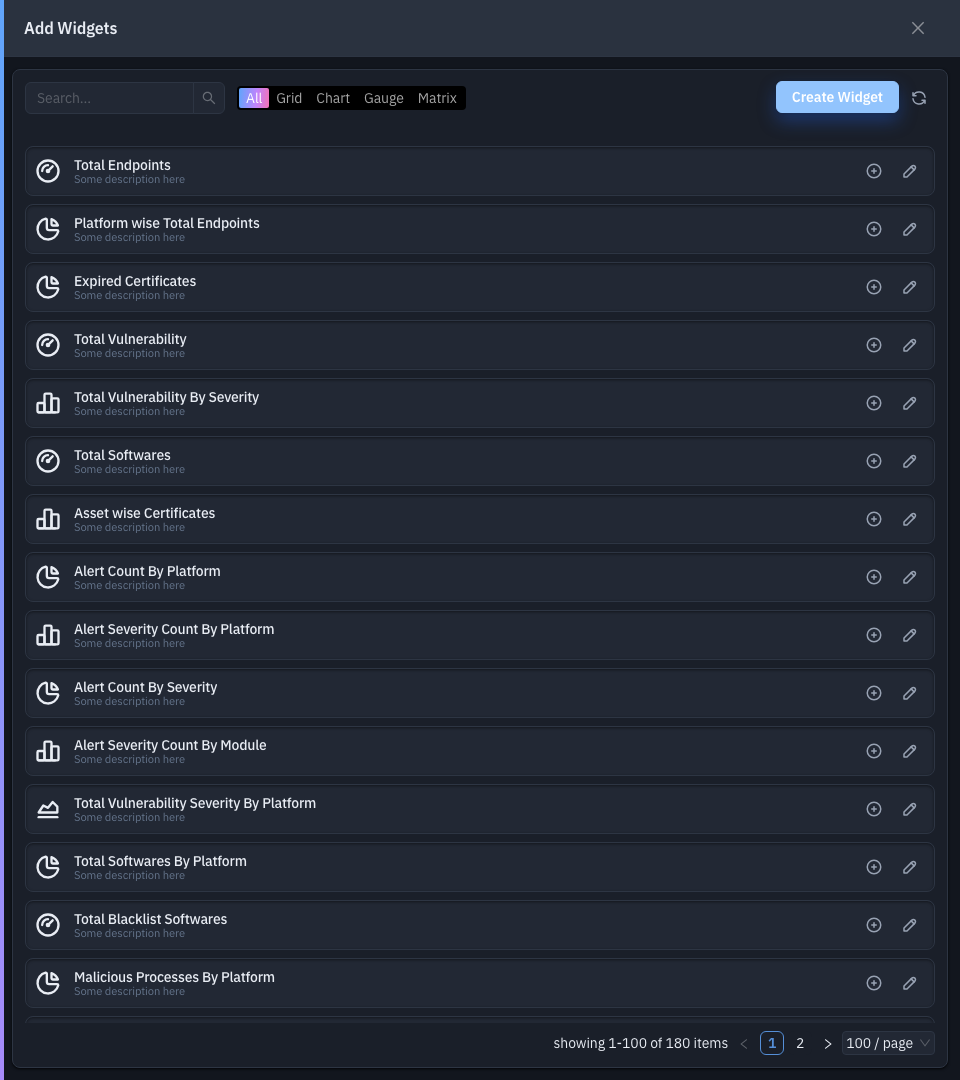
It's a searchable catalogue of your saved widgets. Narrow the list with the search box or the category filter (All / Grid / Chart / Gauge / Matrix). Each row shows the widget's type icon, name, and description (a Generated by GAS AI tag marks AI-created ones). On each row you can:
- Click + (Add to Dashboard) to drop the widget onto the dashboard, or drag the row onto the grid to place it exactly where you want.
- Click the pencil (Edit Widget) to open its definition in the builder.
Click Create Widget (top-right of the panel) to build a brand-new widget from scratch.
Widget types
Pick the type that fits the data. The builder offers eleven:
| Type | Best for |
|---|---|
| Grid | A table of rows and columns- the most detail per widget. |
| Bar / Stacked Bar | Comparing values across categories (stack to show parts of a whole). |
| Area / Stacked Area | Trends over time, drawn as filled volume. |
| Line / Stacked Line | Trends over time, drawn as lines. |
| Pie | One value split into proportions (share of a whole). |
| Gauge | A single headline number- a count or score- optionally colour-coded. |
| Vulnerability Matrix | The severity-versus-age heat grid used for vulnerabilities. |
| Sankey | Flow between stages (for example total → severity → exploitability). |
Step 2- Build the widget (with live preview)
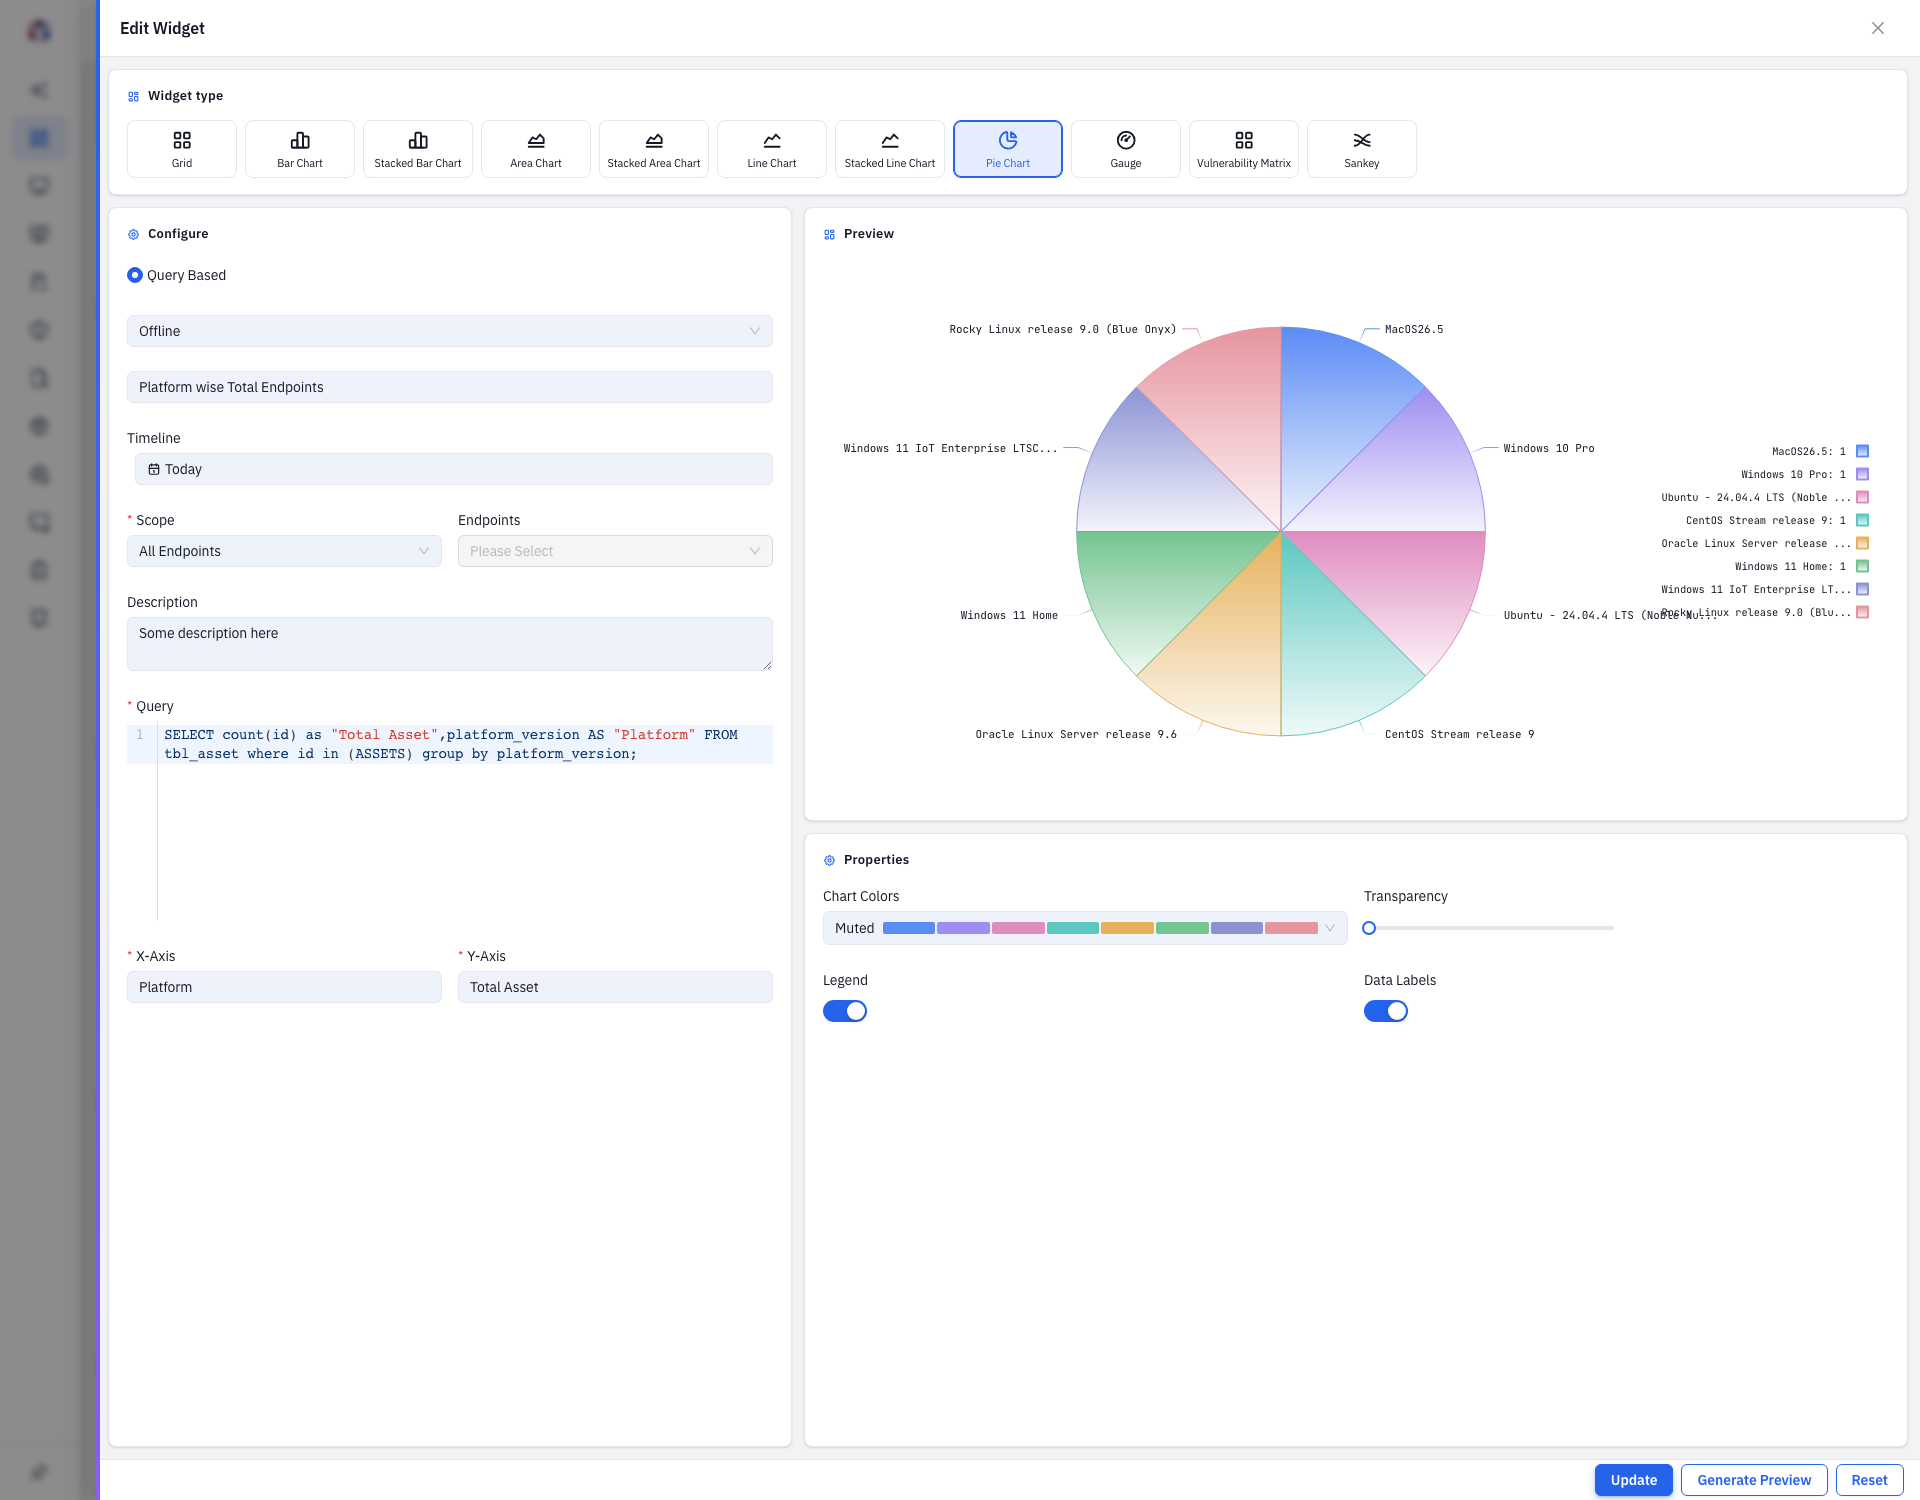
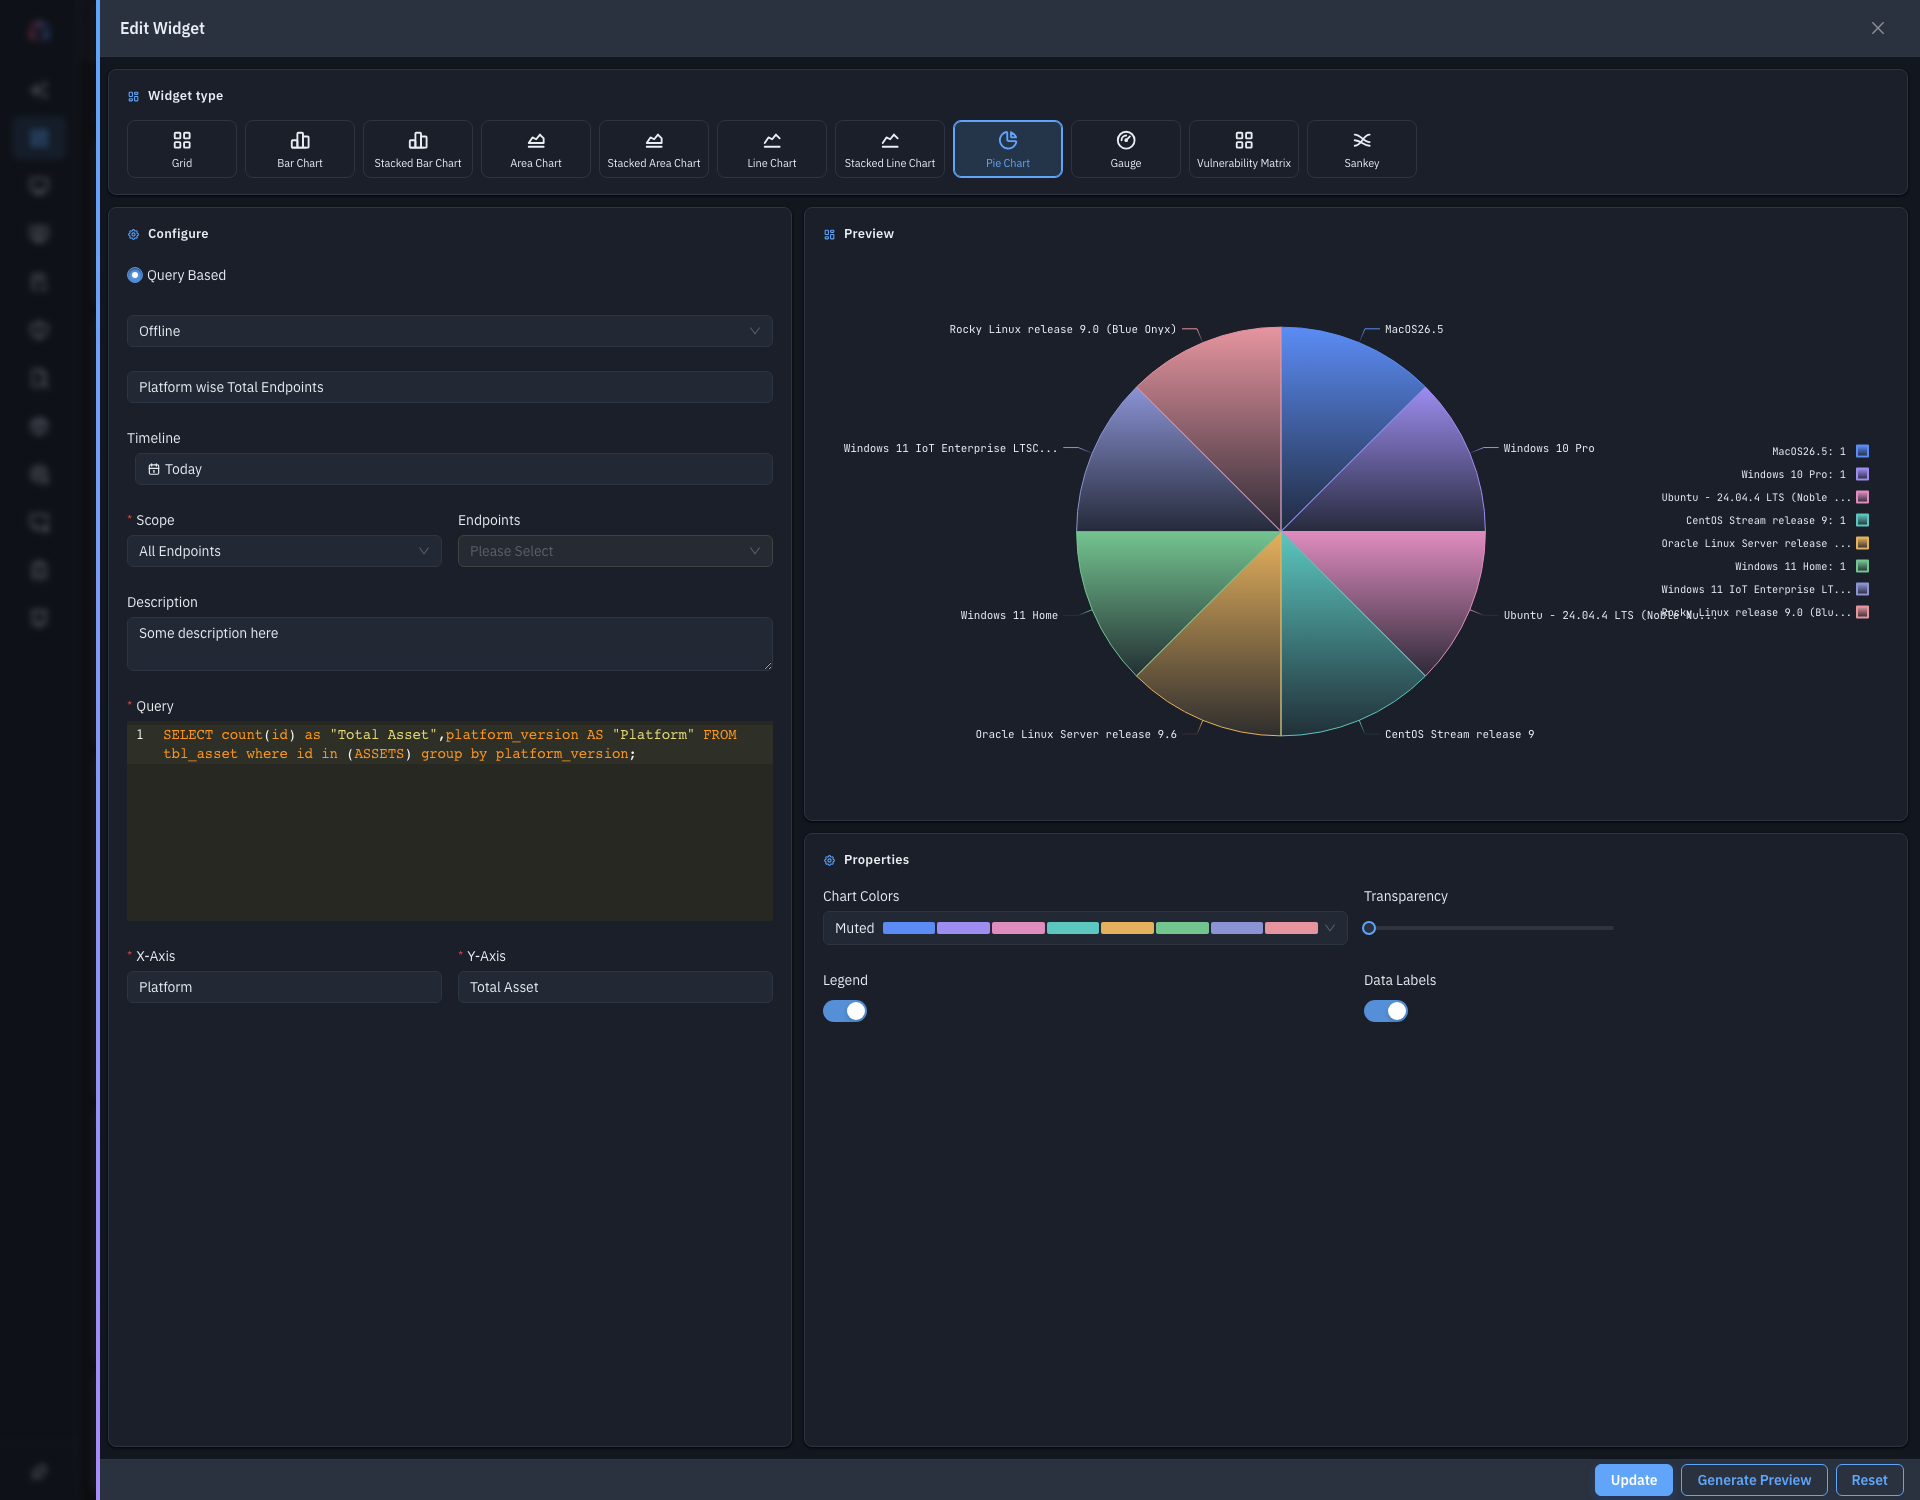
The builder puts the widget-type picker across the top, the Configure form on the left, and the Preview and Properties panels on the right. Editing an existing widget opens it pre-filled with its preview already rendered:
-
Pick a widget type from the row at the top.
-
Fill in the Configure form (red asterisk = required):
Field Required Notes Query Based Yes How the widget is defined. Query Based is the current method. Widget Operation Type Yes Offline reports on data EndpointOps has already collected. (Live is reserved for a future release and can't be selected yet.) Name Yes The title shown on the widget. Timeline - The time range the widget reports on (Today, This Week, and so on). Scope Yes Which endpoints the widget covers- a filter (all, department, location…) plus an optional Endpoints picker for specific machines. Description No Shown via the widget's info icon on the dashboard. Query Yes The query that returns the widget's data. Column aliases you set here (e.g. AS "Platform") become the fields you pick for the axes.X-Axis / Y-Axis Yes* The columns to plot, for chart types. A Gauge uses a single Result Key instead; Grid uses neither (it shows every column). -
Click Generate Preview to run the query and render the widget in the Preview panel. (When you edit an existing widget, the preview is already there.)
Once a preview exists, the Properties panel tailors the widget's look to its type:
- Charts (Bar, Area, Line and their stacked variants)- Chart Colors (a named palette), Rotation (tilt the axis labels), Transparency, X-Axis Title, Y-Axis Title, and a Legend toggle.
- Pie / Sankey- Chart Colors, Transparency, and Legend; Pie adds a Data Labels toggle.
- Grid- one row per column with an editable Title, an Ellipsis toggle (truncate long text) and a Hidden toggle; drag the handle to reorder columns. Column Settings (gear) open Color rules and Value rules: if a cell's value equals / is greater than / contains / … a threshold, colour its background or text, or replace / prefix / suffix the displayed value. Rules run top to bottom and the first match wins.
- Gauge- Horizontal and Vertical Alignment, a Unit and a Label
suffix, and Color Configuration: paint the gauge a background and text colour
when the value crosses a threshold (
<,>,=,≥,≤); reorderable, first match wins. - Vulnerability Matrix- no extra properties.
Click Create (or Update when editing) to save. Reset clears your changes.
Step 3- Place and arrange widgets
The dashboard is a 12-column grid, and your layout saves automatically as you go.
- Add a widget with the + button (it drops into the next free space) or by dragging its row from the panel to an exact spot.
- Move a widget by dragging its header- the chart or table body itself isn't a drag handle, so you can still scroll and interact with it.
- Resize a widget by dragging its bottom-right corner.
- Hover a widget for its controls: the info (ℹ) icon shows its description, and the ⋮ More menu (needs Update Dashboard) has Edit- which reopens the builder with the live preview- and Remove.
How do I refresh or export?
- Refresh- click Refresh to pull fresh data into every widget at once.
- Export- click the download icon to save the dashboard as an image (handy for reports or sharing a snapshot).
Tips & troubleshooting
- I don't see the Dashboard menu. Your role needs View Dashboard. Ask your administrator.
- No widgets show. A new dashboard starts empty- use Add Widget. If an existing dashboard is blank, click Refresh; widgets need enrolled endpoints reporting data.
- Wrong dashboard opens at sign-in. Open the selector and use Set as Default on the one you want.
- I can't add or edit widgets. Adding widgets needs Update Dashboard (or View Widget) permission; creating dashboards needs Create Dashboard.
Related
- Signing in- how you reach the dashboard.
- Enrolling an Endpoint- get endpoints reporting so widgets have data to show.
- Endpoints- drill into the fleet behind the numbers.
- Alerts- investigate the security events widgets surface.