OS Performance
The OS Performance tab drills into how the operating system performs across the fleet- boot experience and OS crashes- over the last 15 days.
How to get here
- Open DEX (see DEX Summary).
- Click the OS Performance tab.
URL path: /dex/os-performance
The OS Performance screen
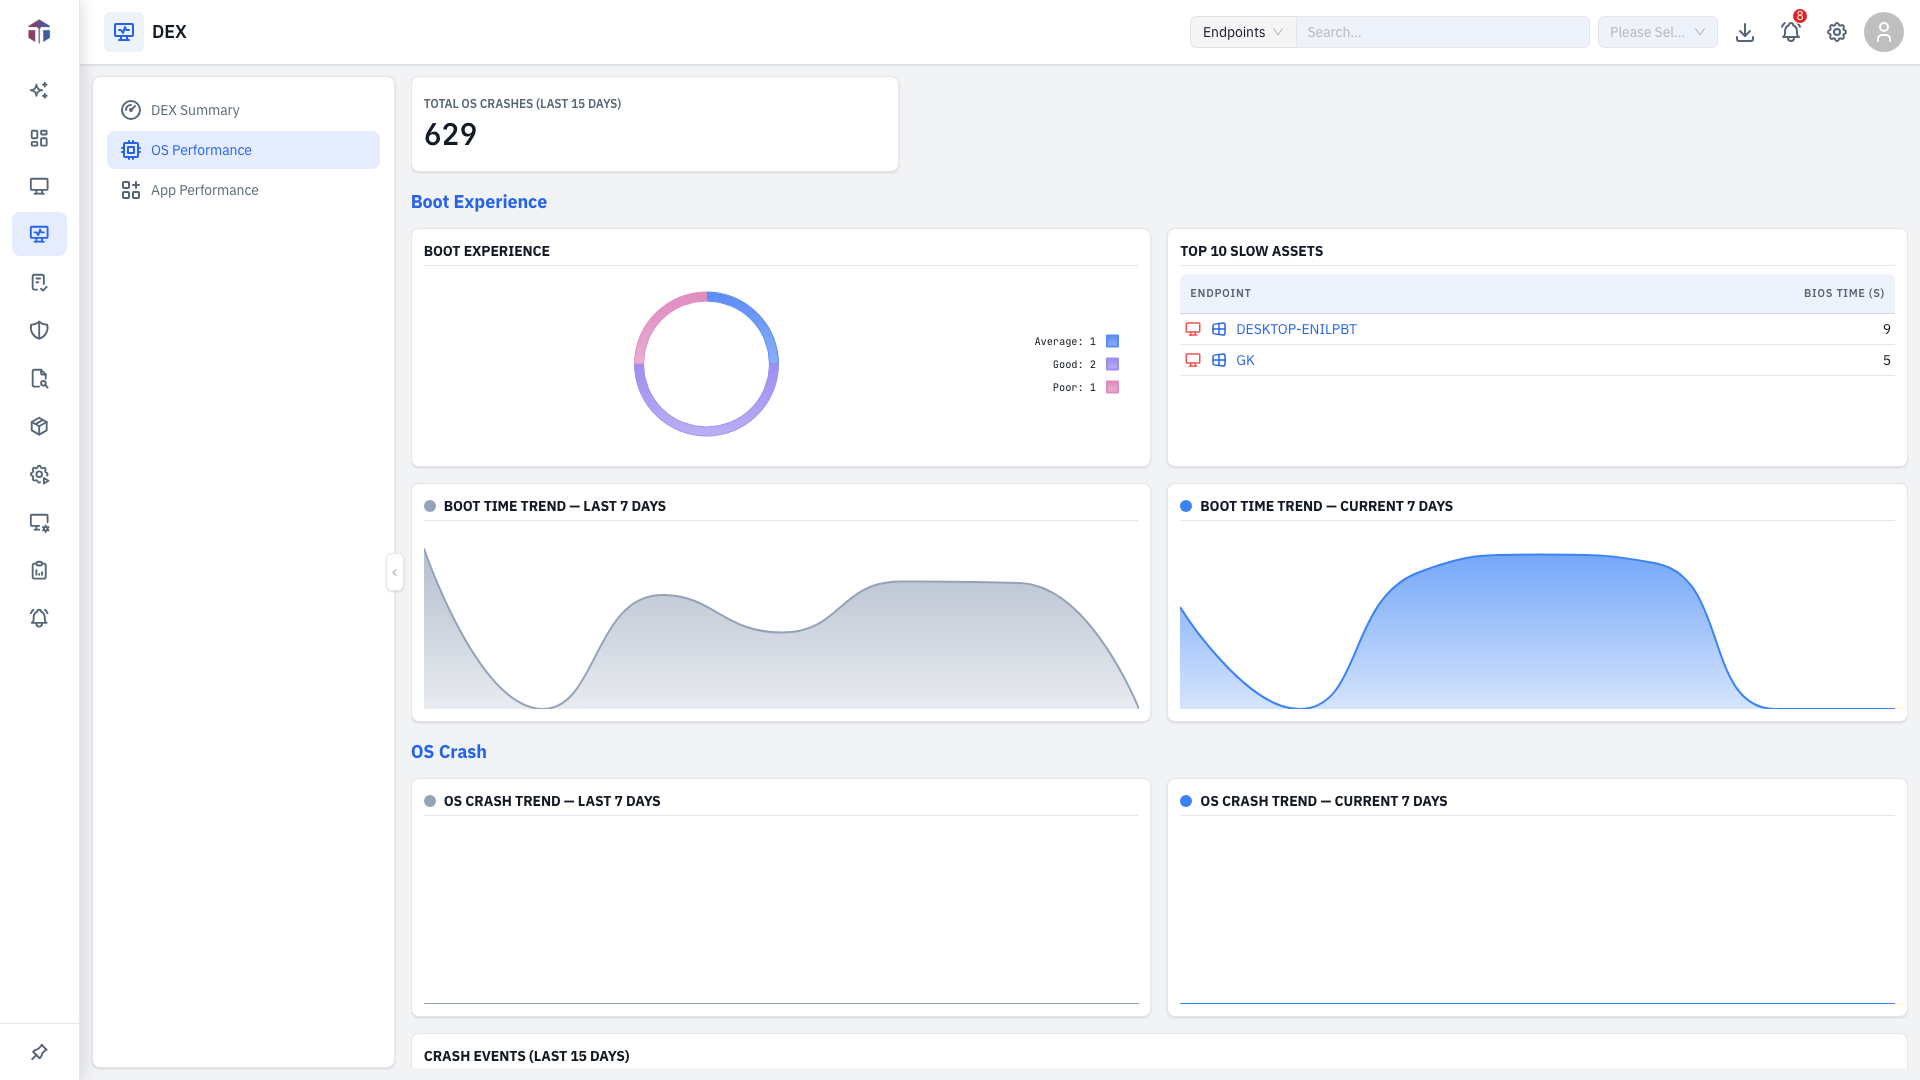
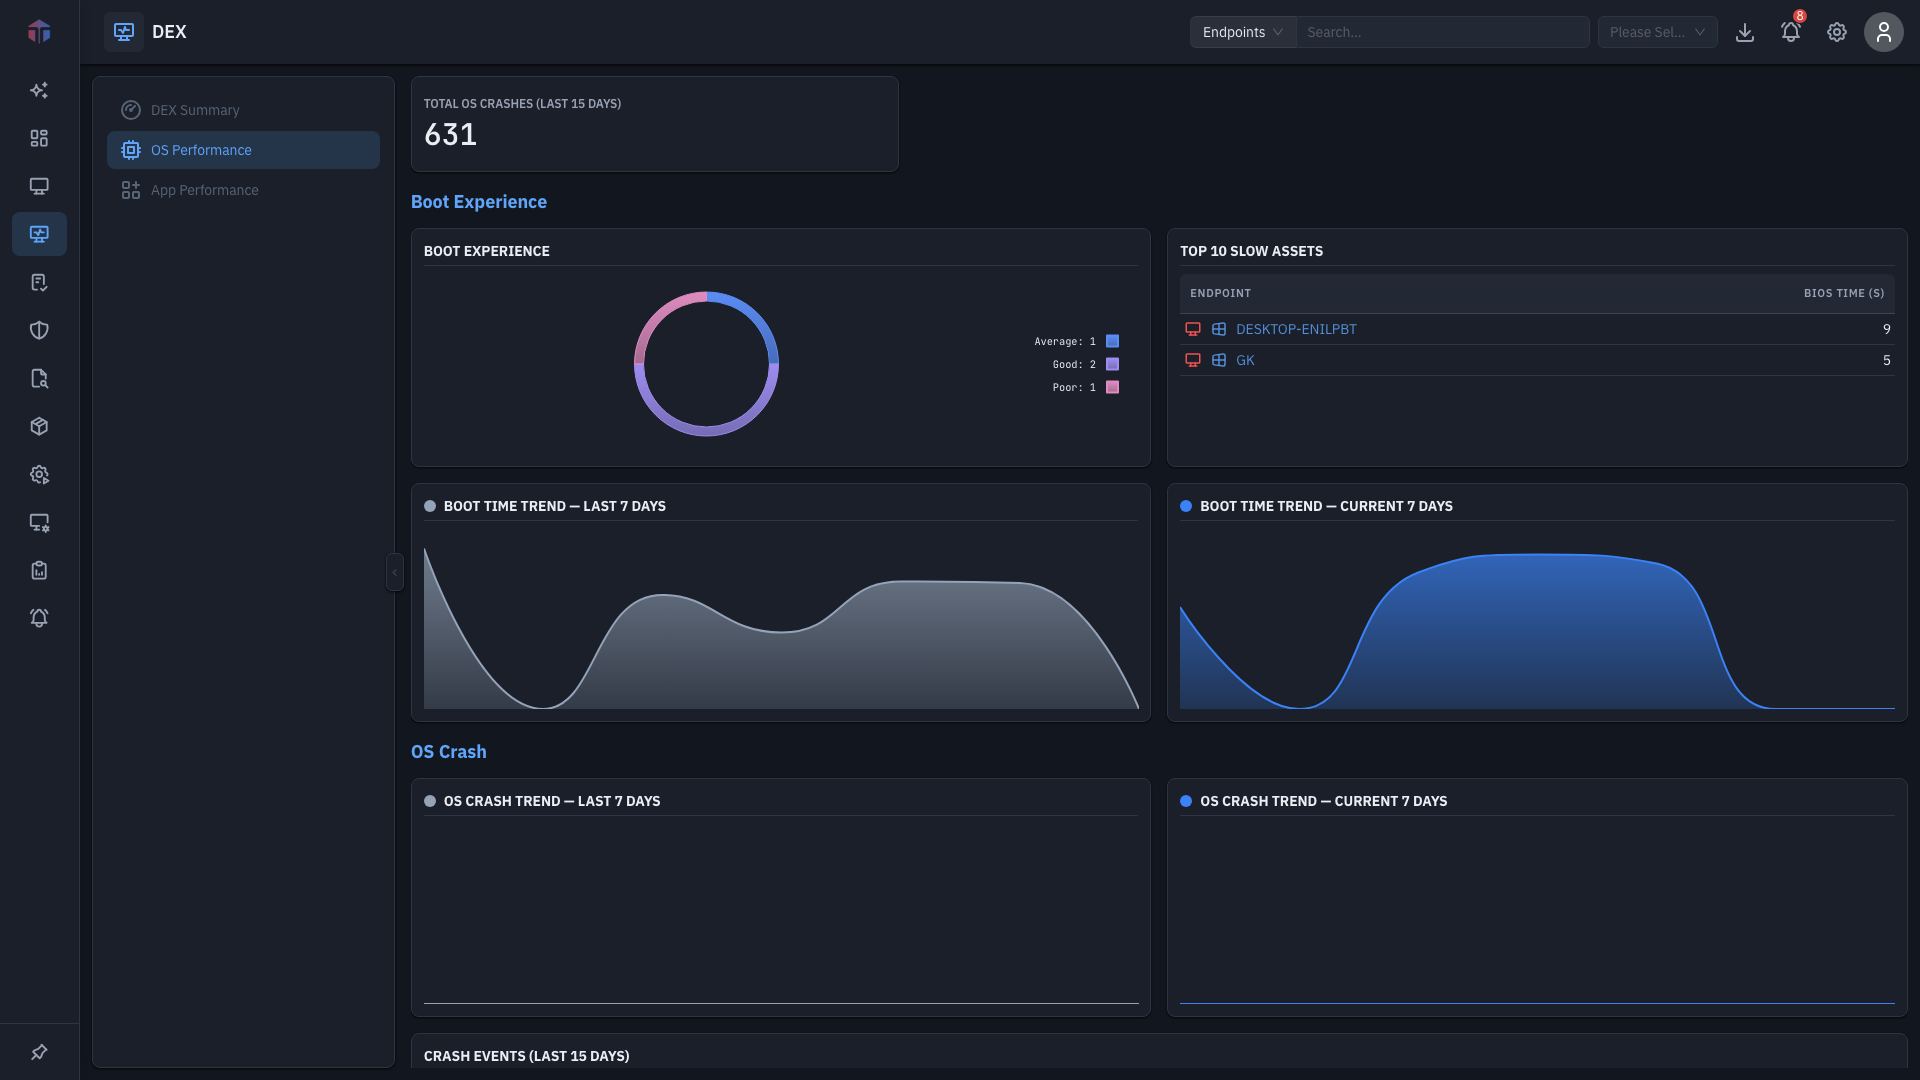
- Total OS Crashes (last 15 days)- a headline count tile.
Boot experience
- Boot Experience- machines grouped by boot-time category (click a bar to open the endpoint list for that category).
- Top 10 Slow Assets- Endpoint + BIOS Time (s).
- Boot Time Trend- last-7-days and current-7-days trend lines.
OS crash
- OS Crash Trend- last / current 7 days.
- Crash Events (last 15 days) table:
| Column | What it shows |
|---|---|
| Endpoint | The machine (links to its detail). |
| Time | When the crash occurred. |
| Source | Crash source. |
| Bugcheck Code | The OS bugcheck / stop code. |
| Description | What happened. |
Tips & troubleshooting
- A machine recurs in crash events. Open its endpoint detail to investigate; repeated bugcheck codes point to a driver or hardware fault.
Related
- DEX Summary- the fleet overview.
- App Performance- application crashes, hangs, and slow launches.