DEX Summary
DEX (Digital Employee Experience) measures how good the computing experience is on your endpoints- boot speed, OS and app crashes, app launch times, Wi-Fi, and battery
- rolled into a DEX score. The Summary is the fleet-wide overview; two more tabs drill into OS Performance and App Performance.
How to get here
You need View Inventory permission, and this module requires the EndpointOps edition.
- In the left sidebar, click DEX. You land on the DEX Summary tab.
Navigate to: DEX → DEX Summary
URL path: /dex/summary
The Summary screen
A left tab strip switches between the three DEX views- DEX Summary, OS Performance, and App Performance. The DEX Summary itself is split into five sub-tabs across the top- Overview, Boot, OS Crash, App, and Network & Battery.
Overview
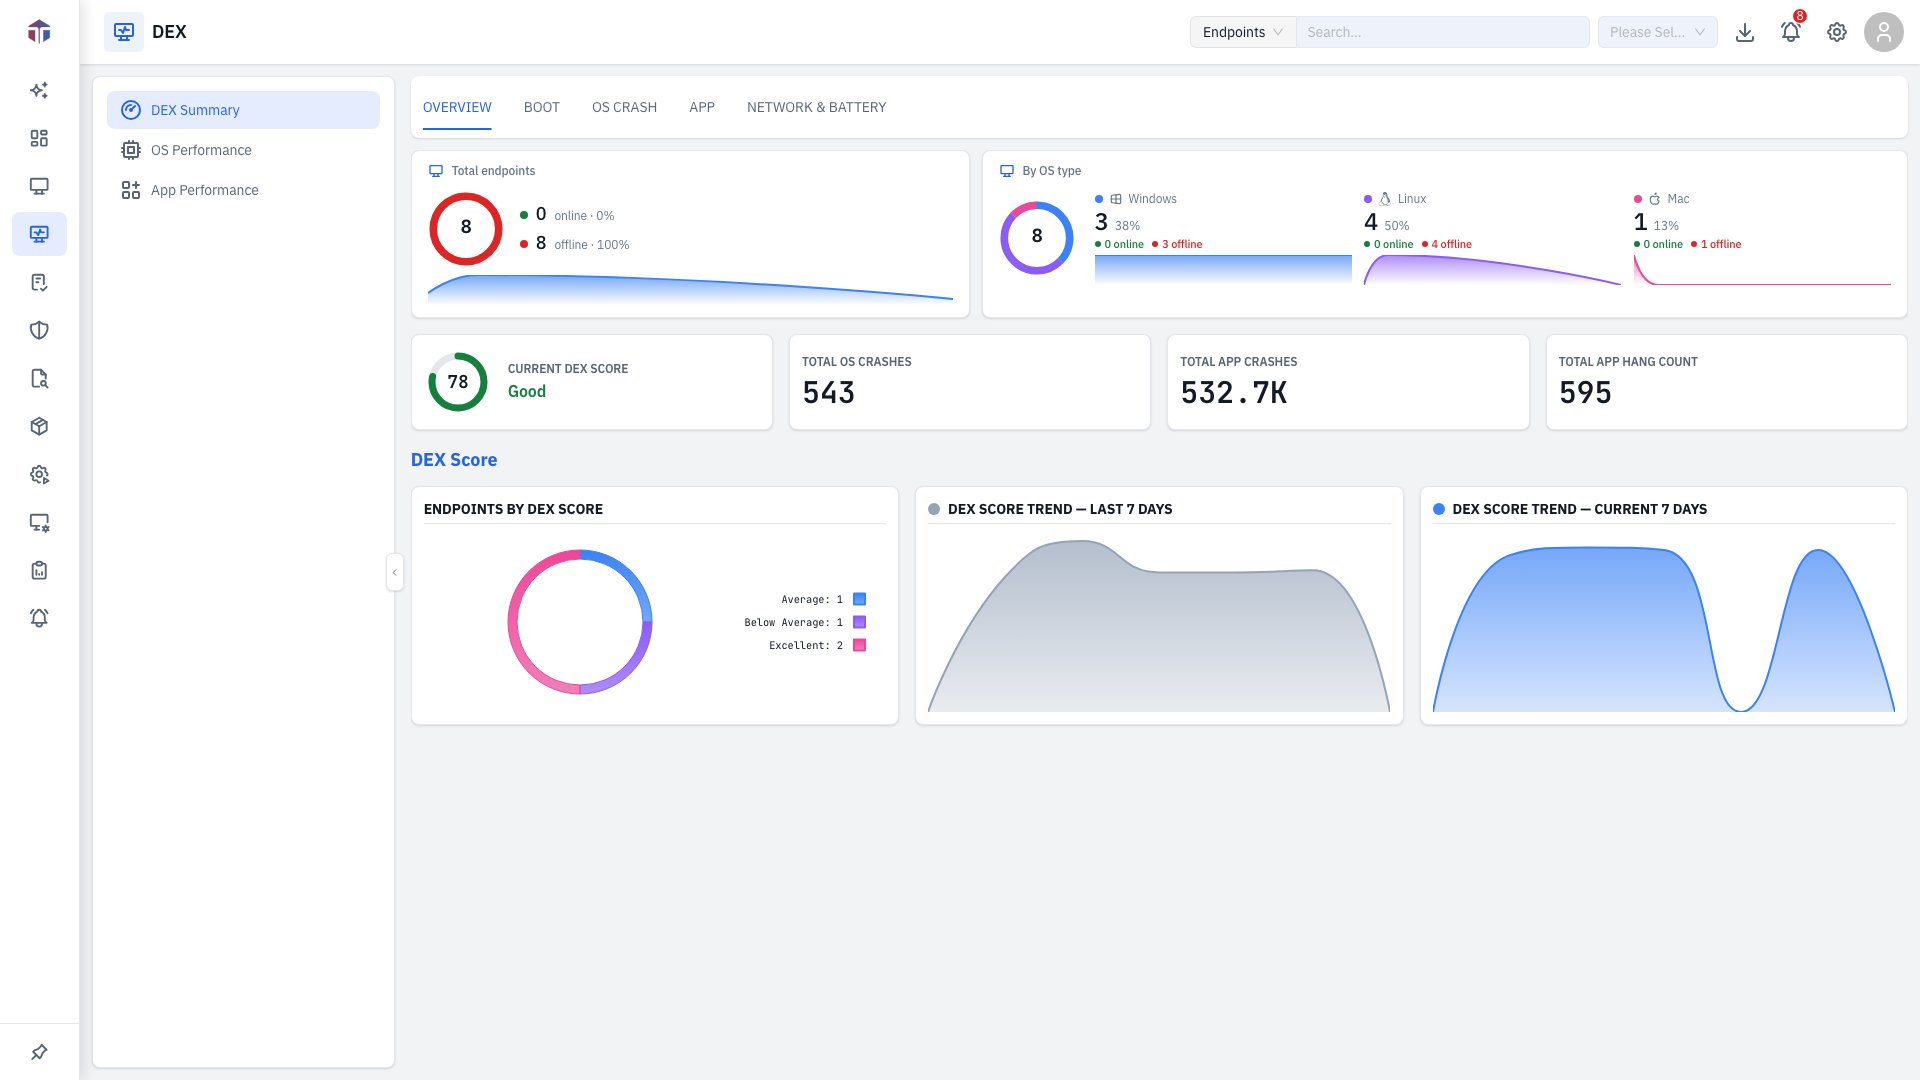
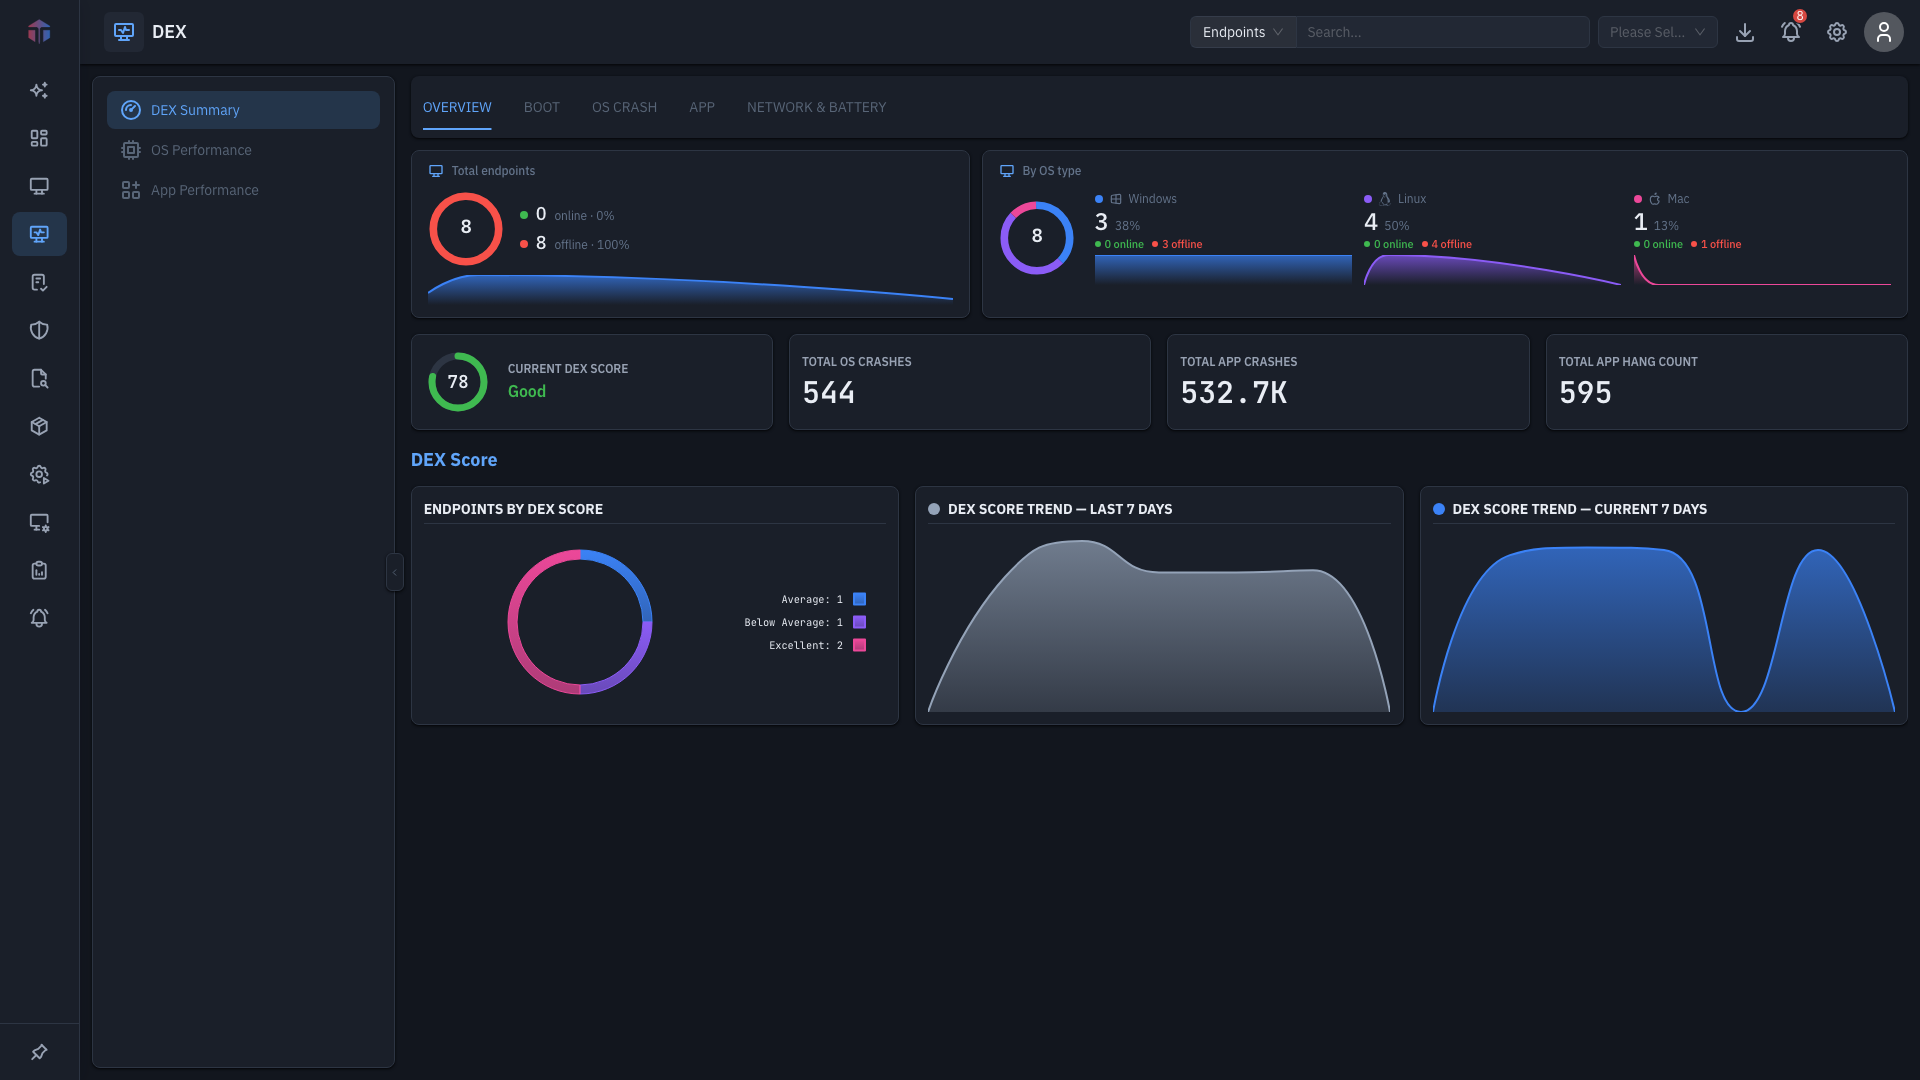
- Score tiles- Current DEX Score (good ≥ 70, average ≥ 40, else poor), Total OS Crashes, Total App Crashes, and Total App Hang Count.
- Endpoints by DEX Score- a distribution of machines by score grade- plus the DEX Score Trend (last-7-days and current-7-days lines).
Boot
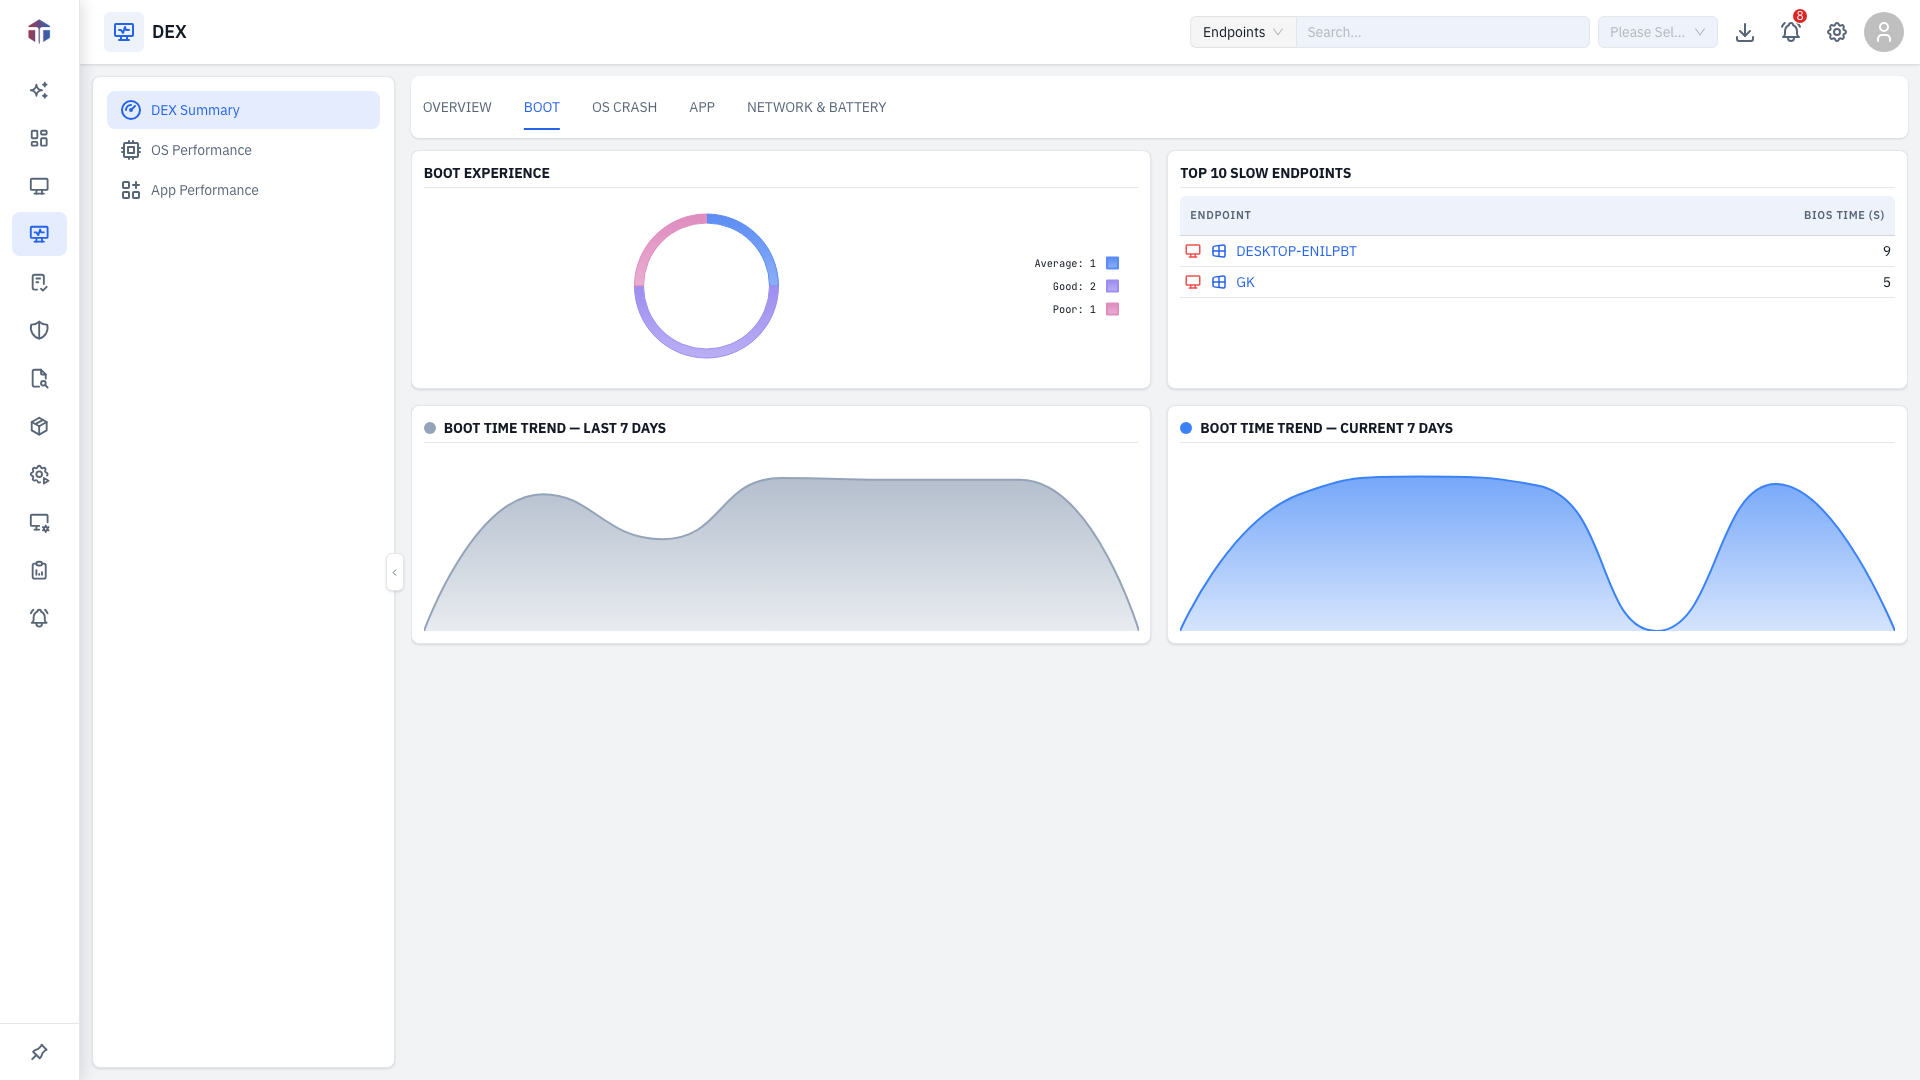
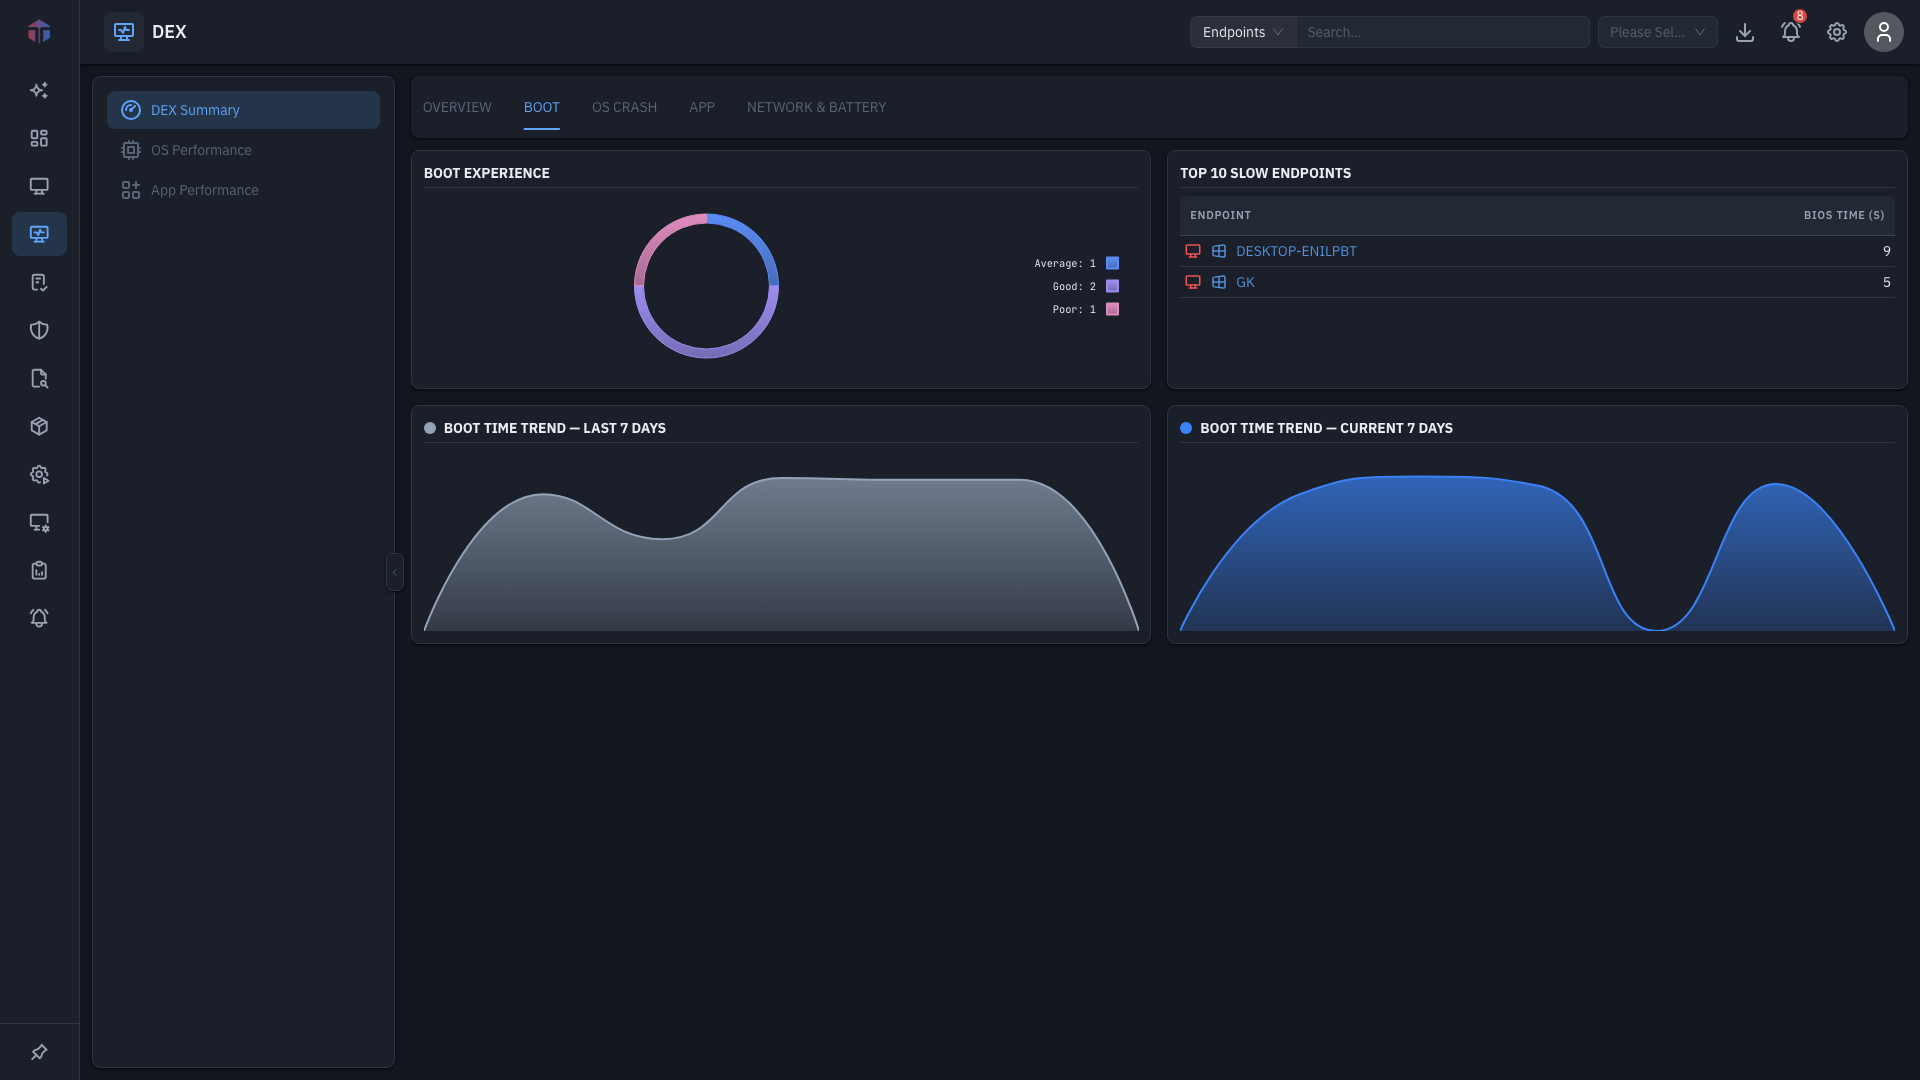
- Boot Experience- machines by boot-time category.
- Top 10 Slow Endpoints- Endpoint + BIOS Time (s).
- Boot Time Trend- last / current 7 days.
OS Crash
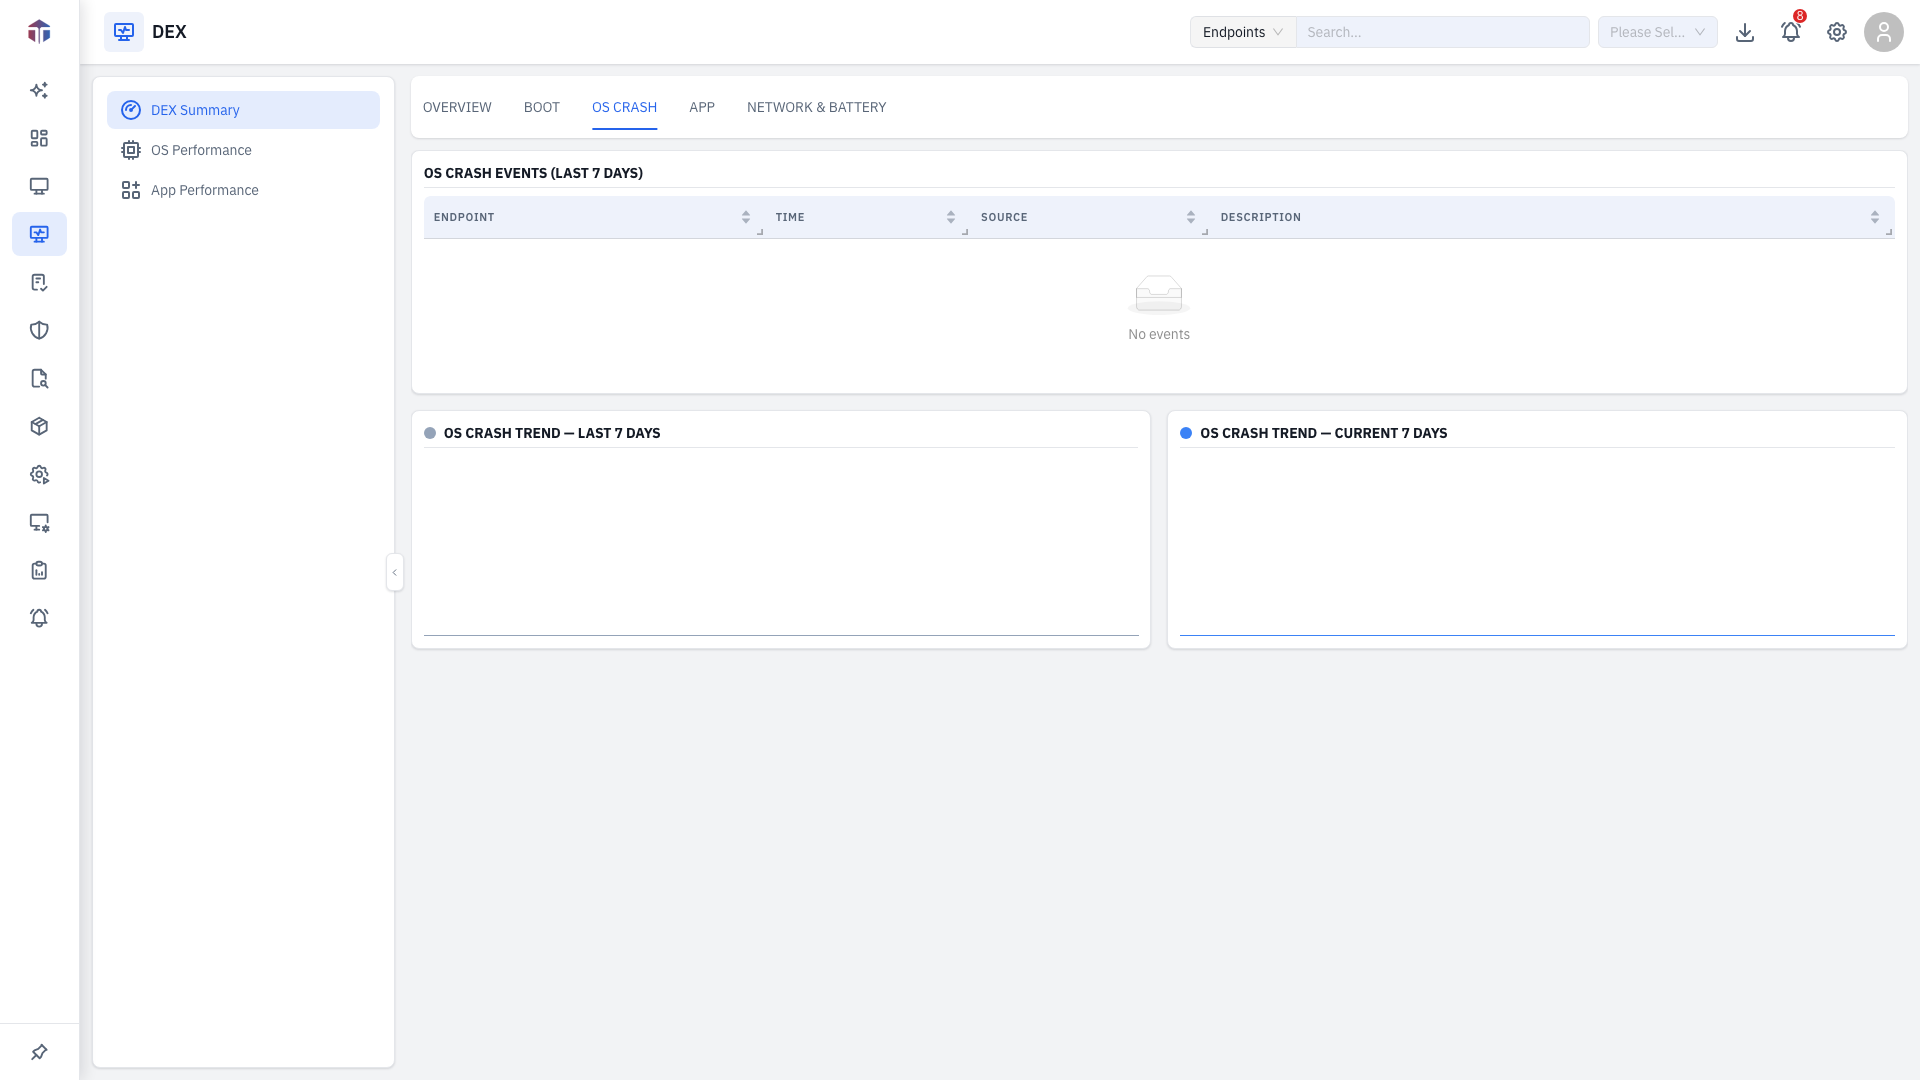
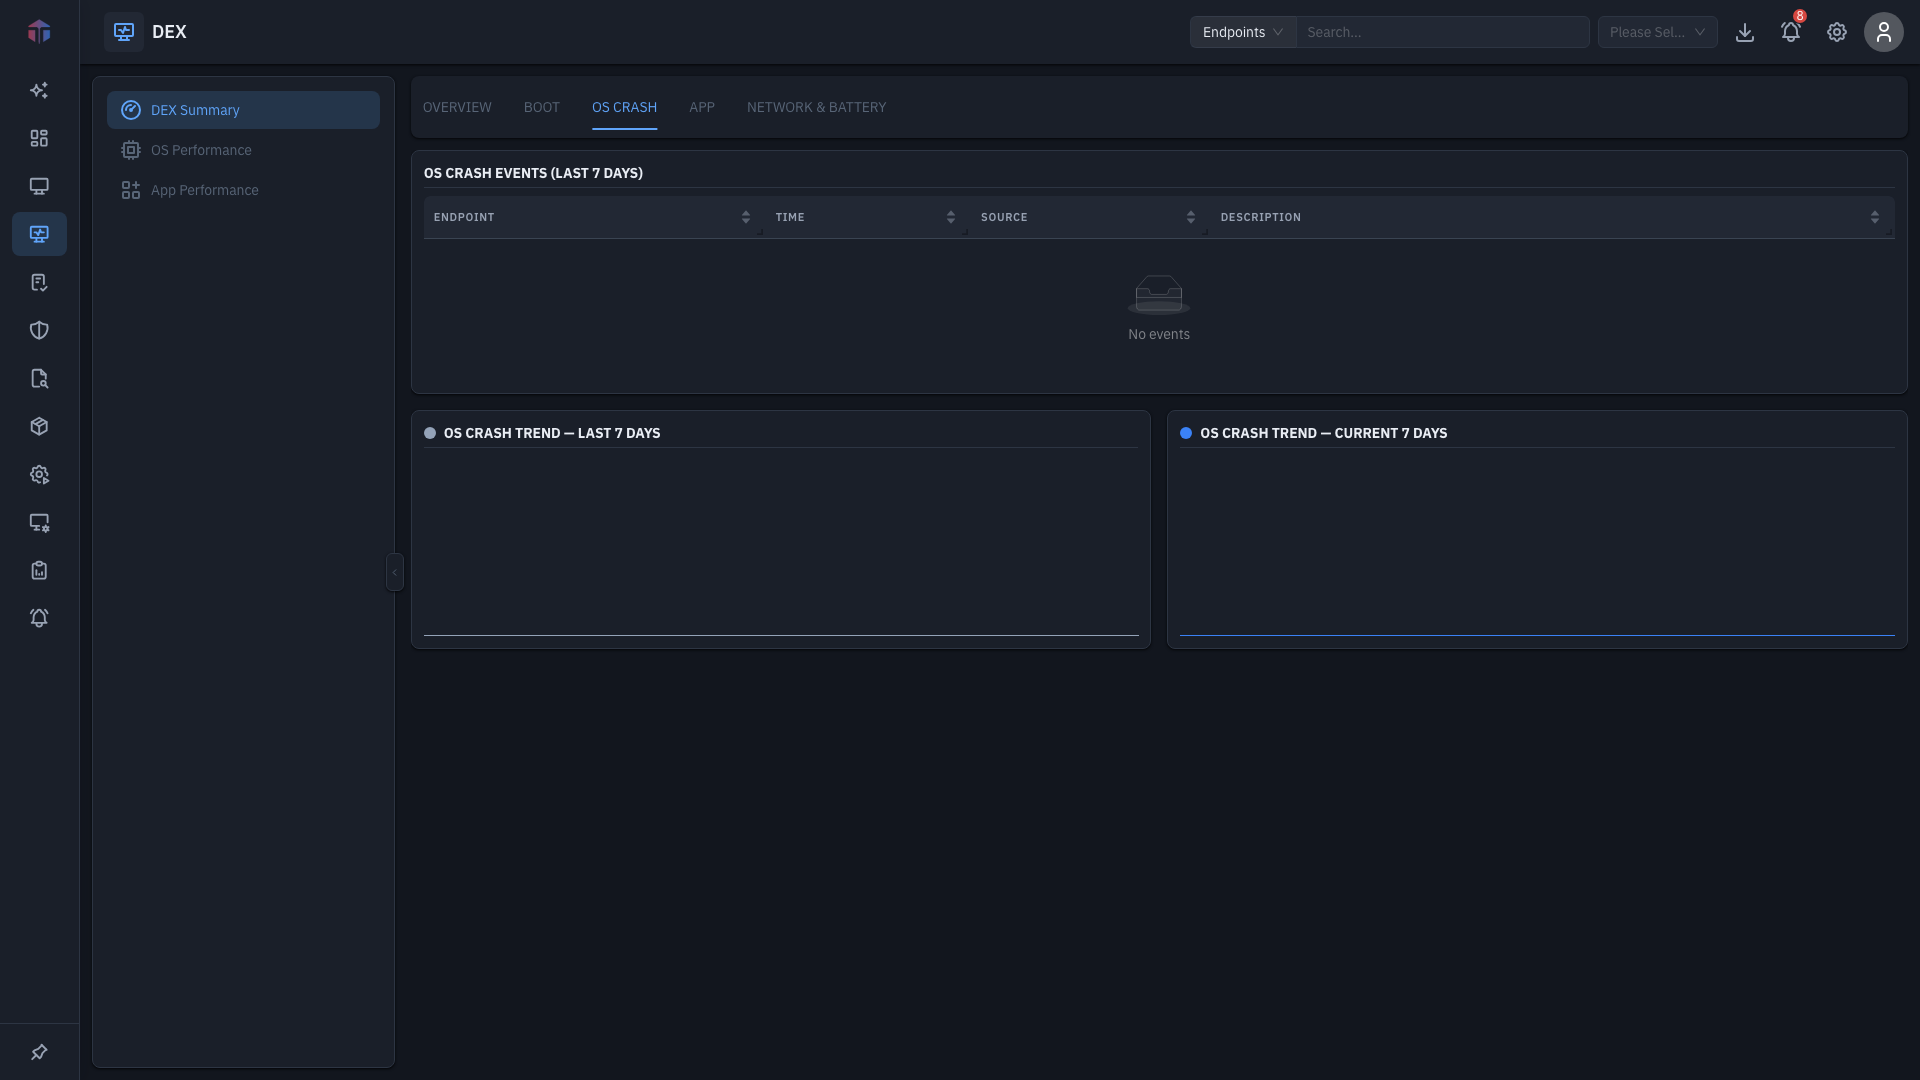
- OS Crash Events (last 7 days)- Endpoint, Time, Source, Description.
- OS Crash Trend- last / current 7 days.
App
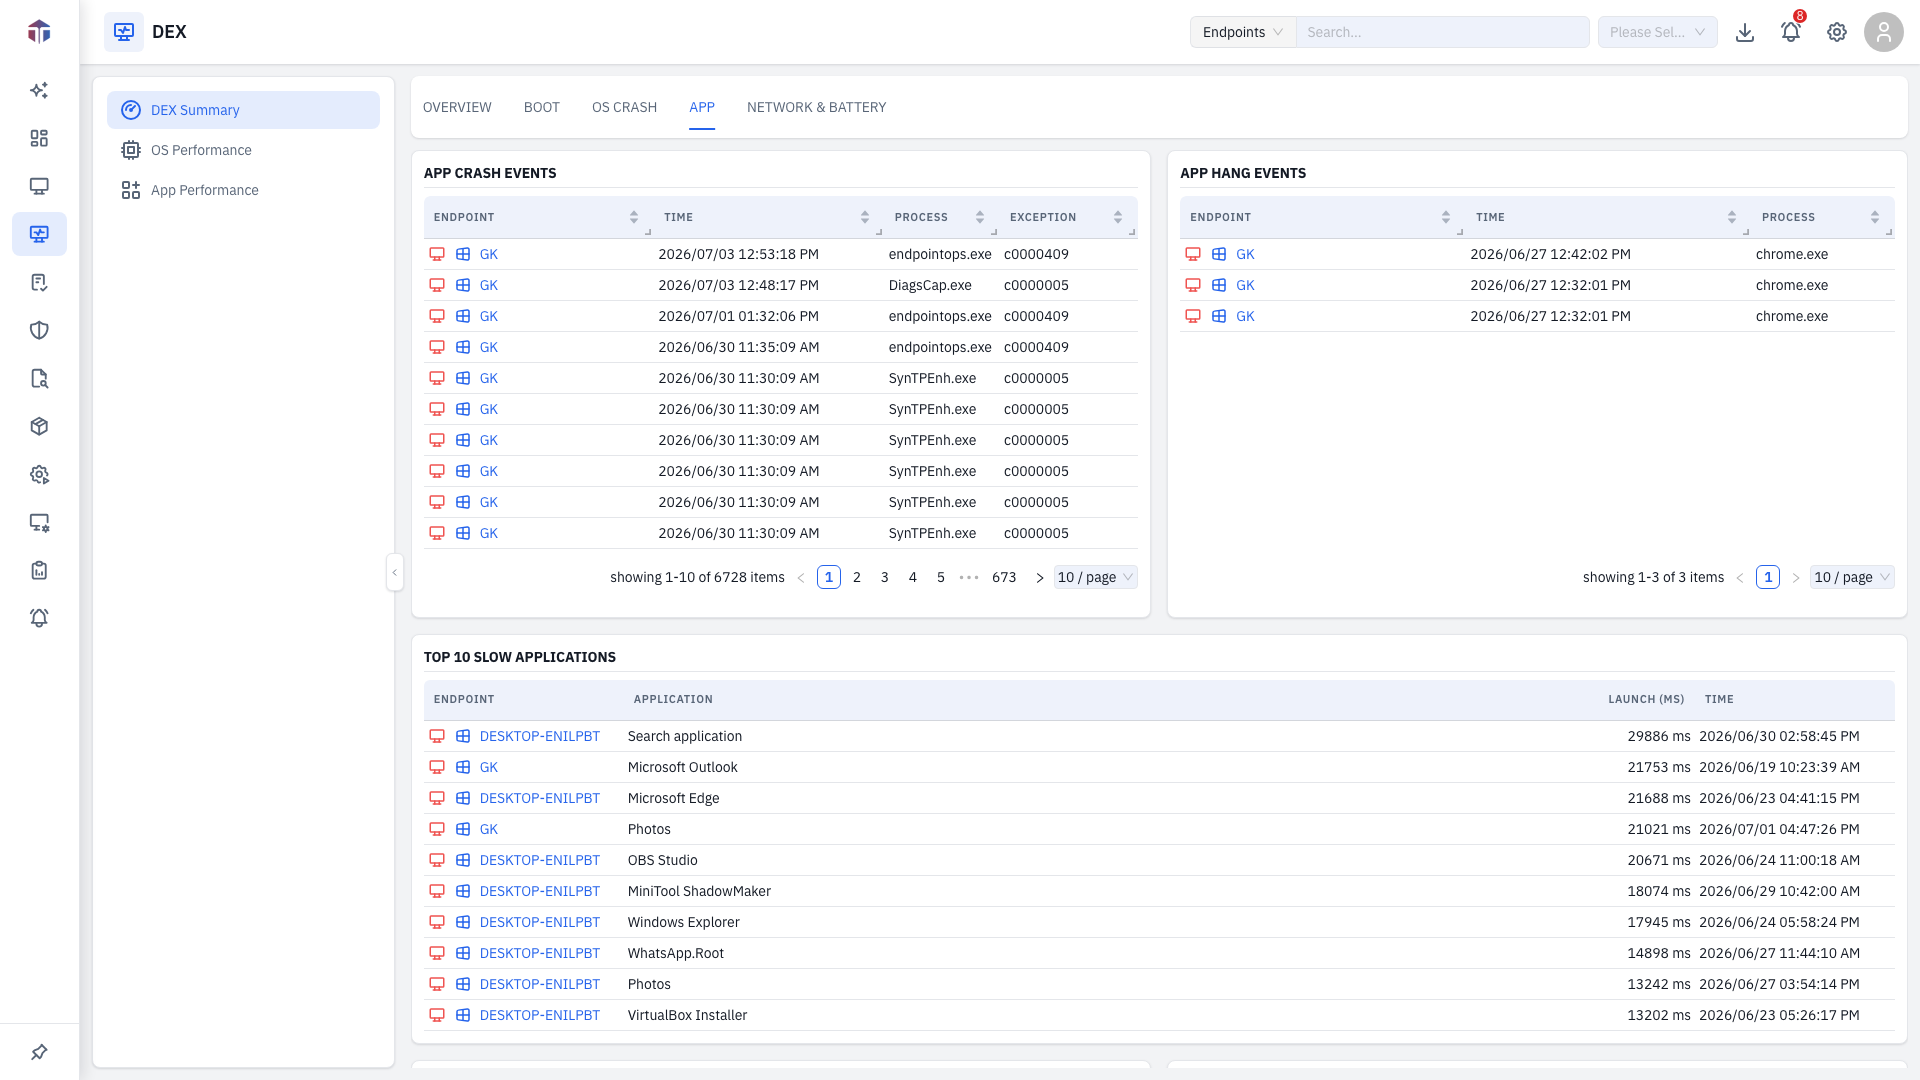
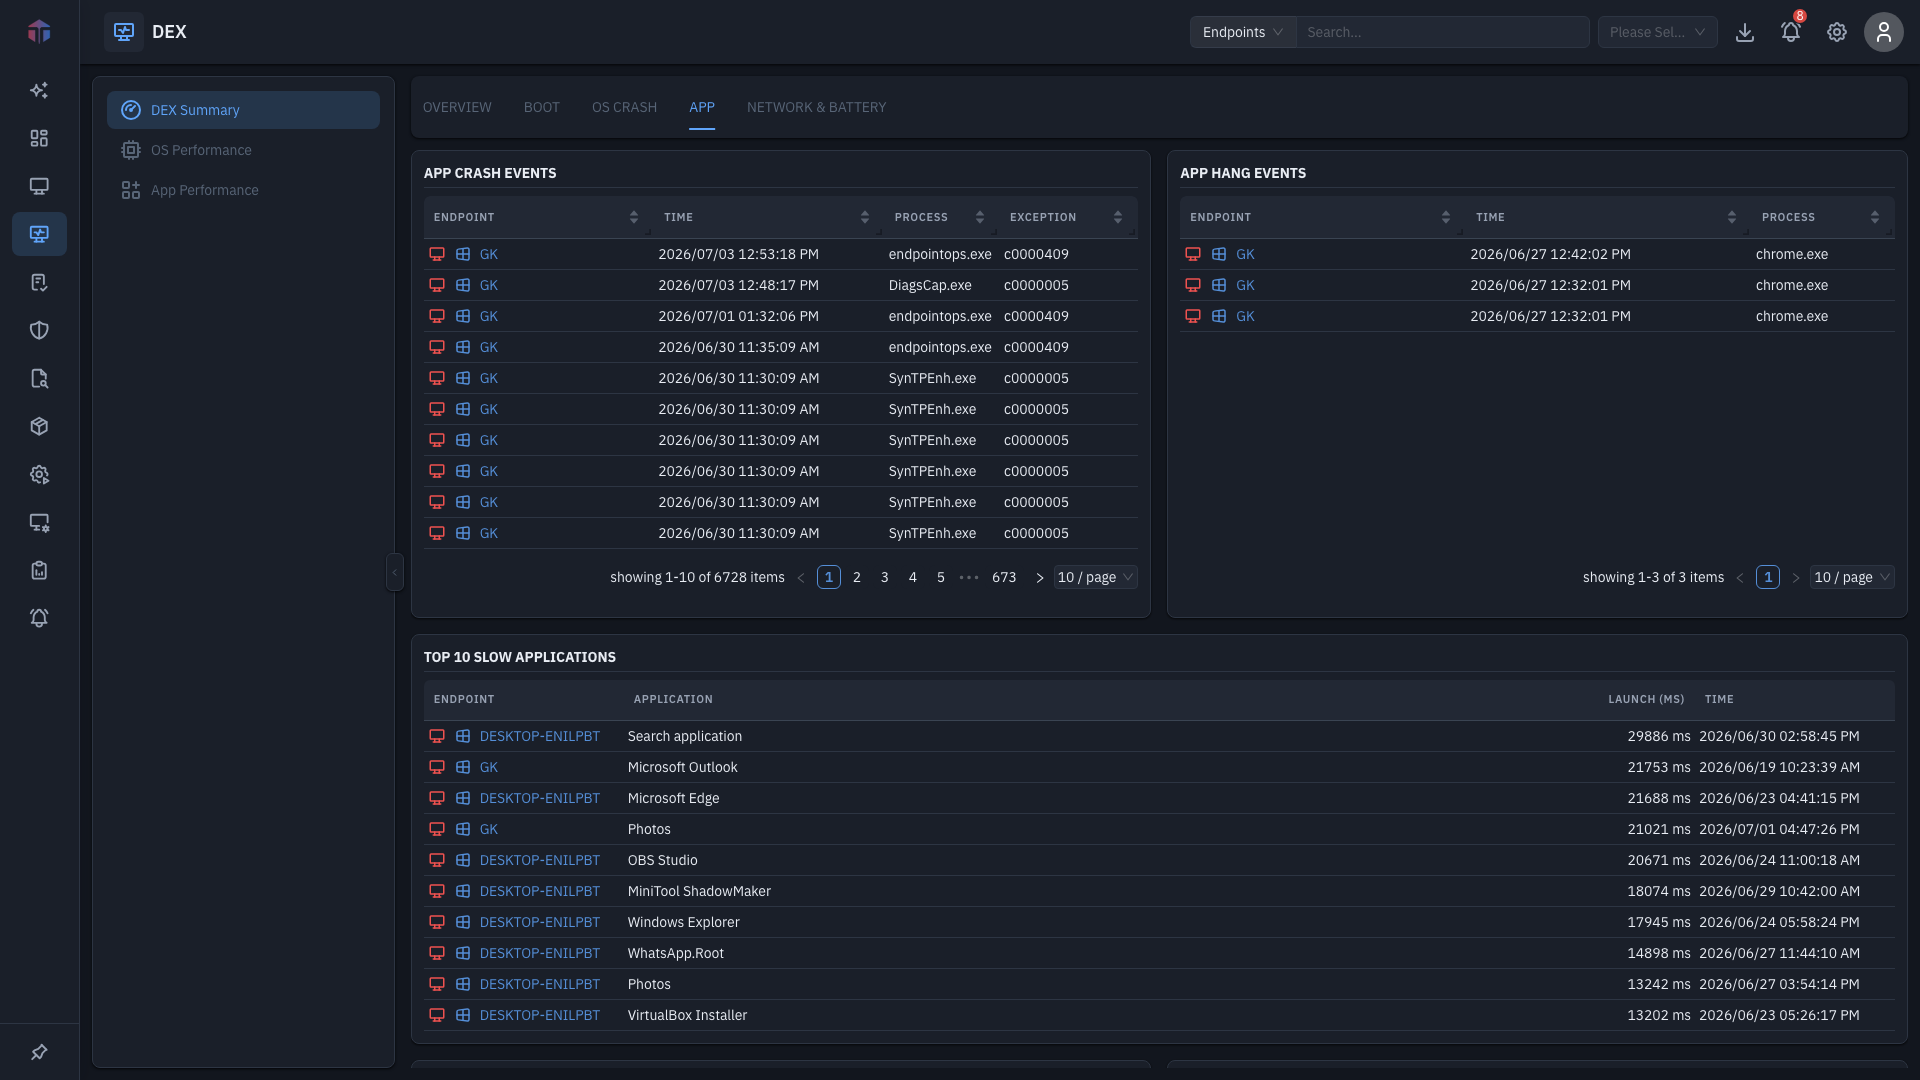
- App Crash Events- Endpoint, Time, Process, Exception.
- App Hang Events- Endpoint, Time, Process.
- Top 10 Slow Applications- Endpoint, Application, Launch (ms), Time.
- App Crash Trend- last / current 7 days.
Network & Battery
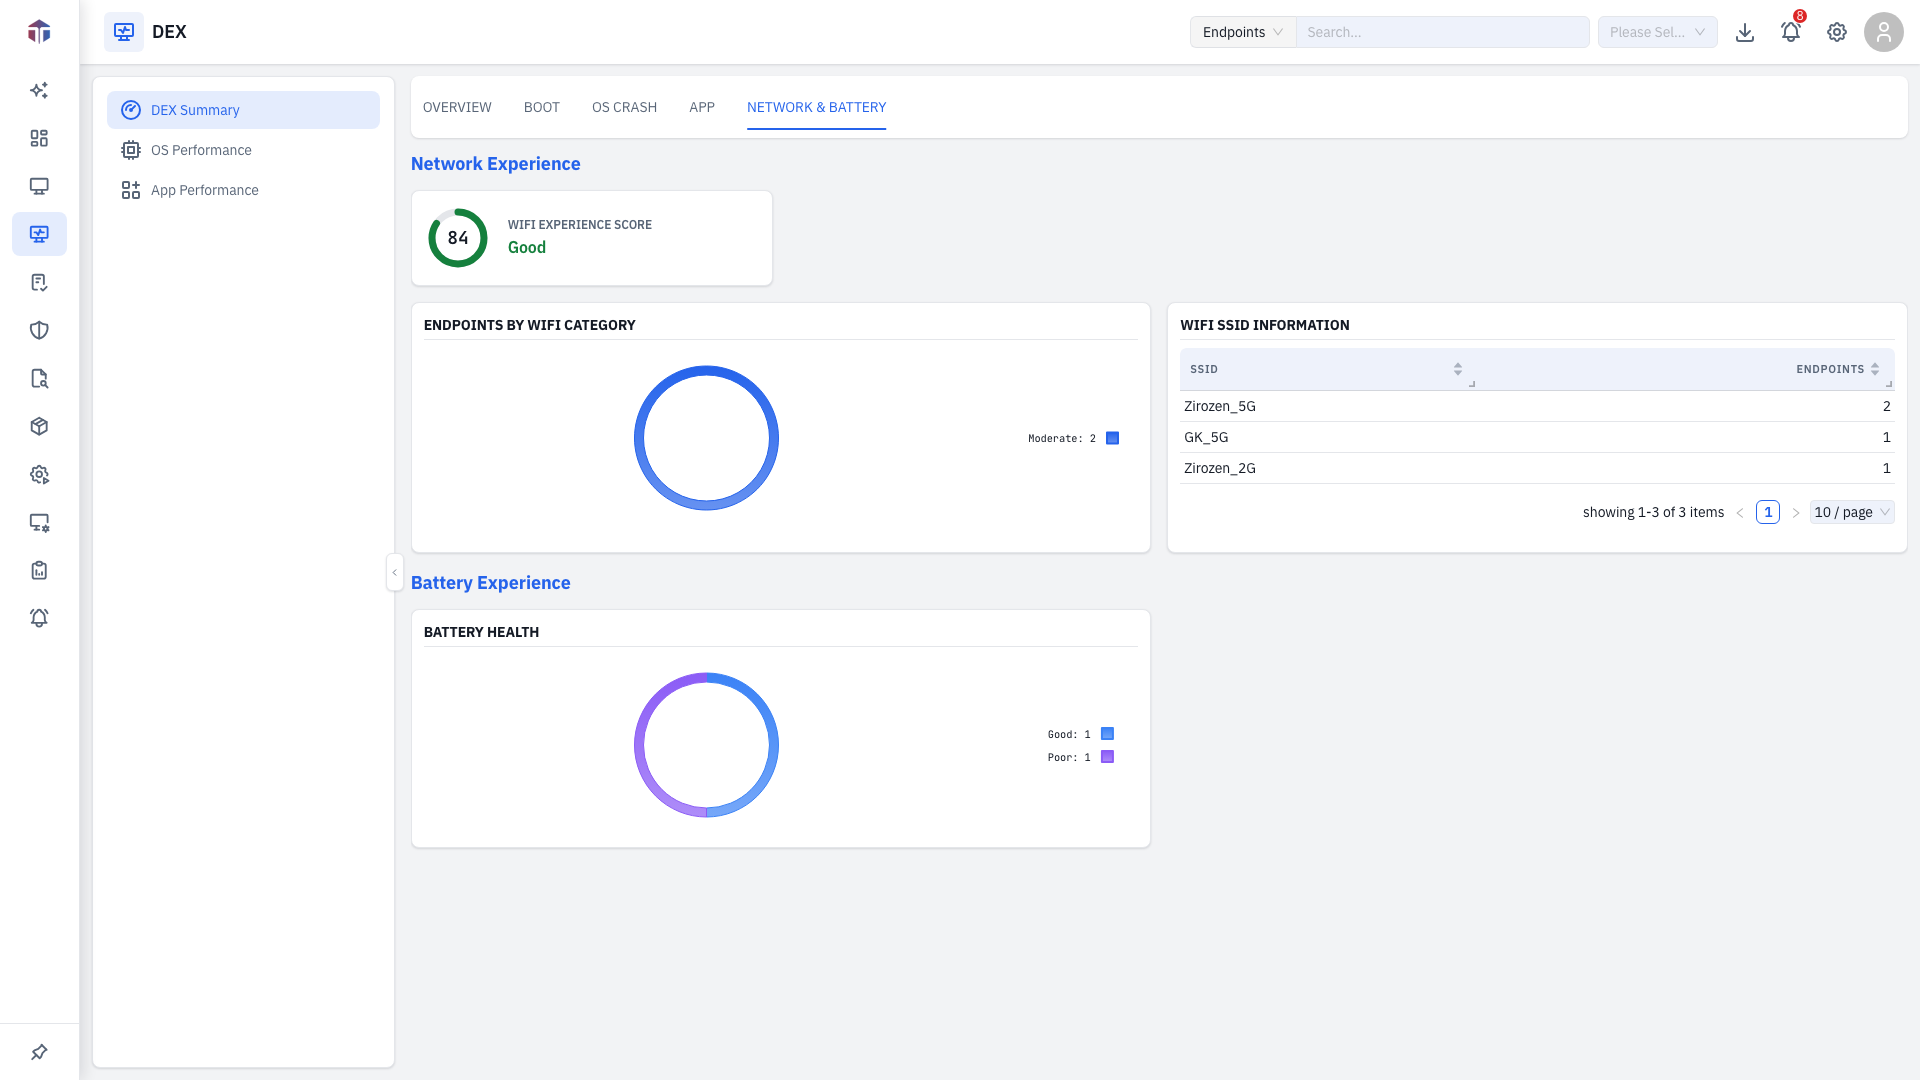
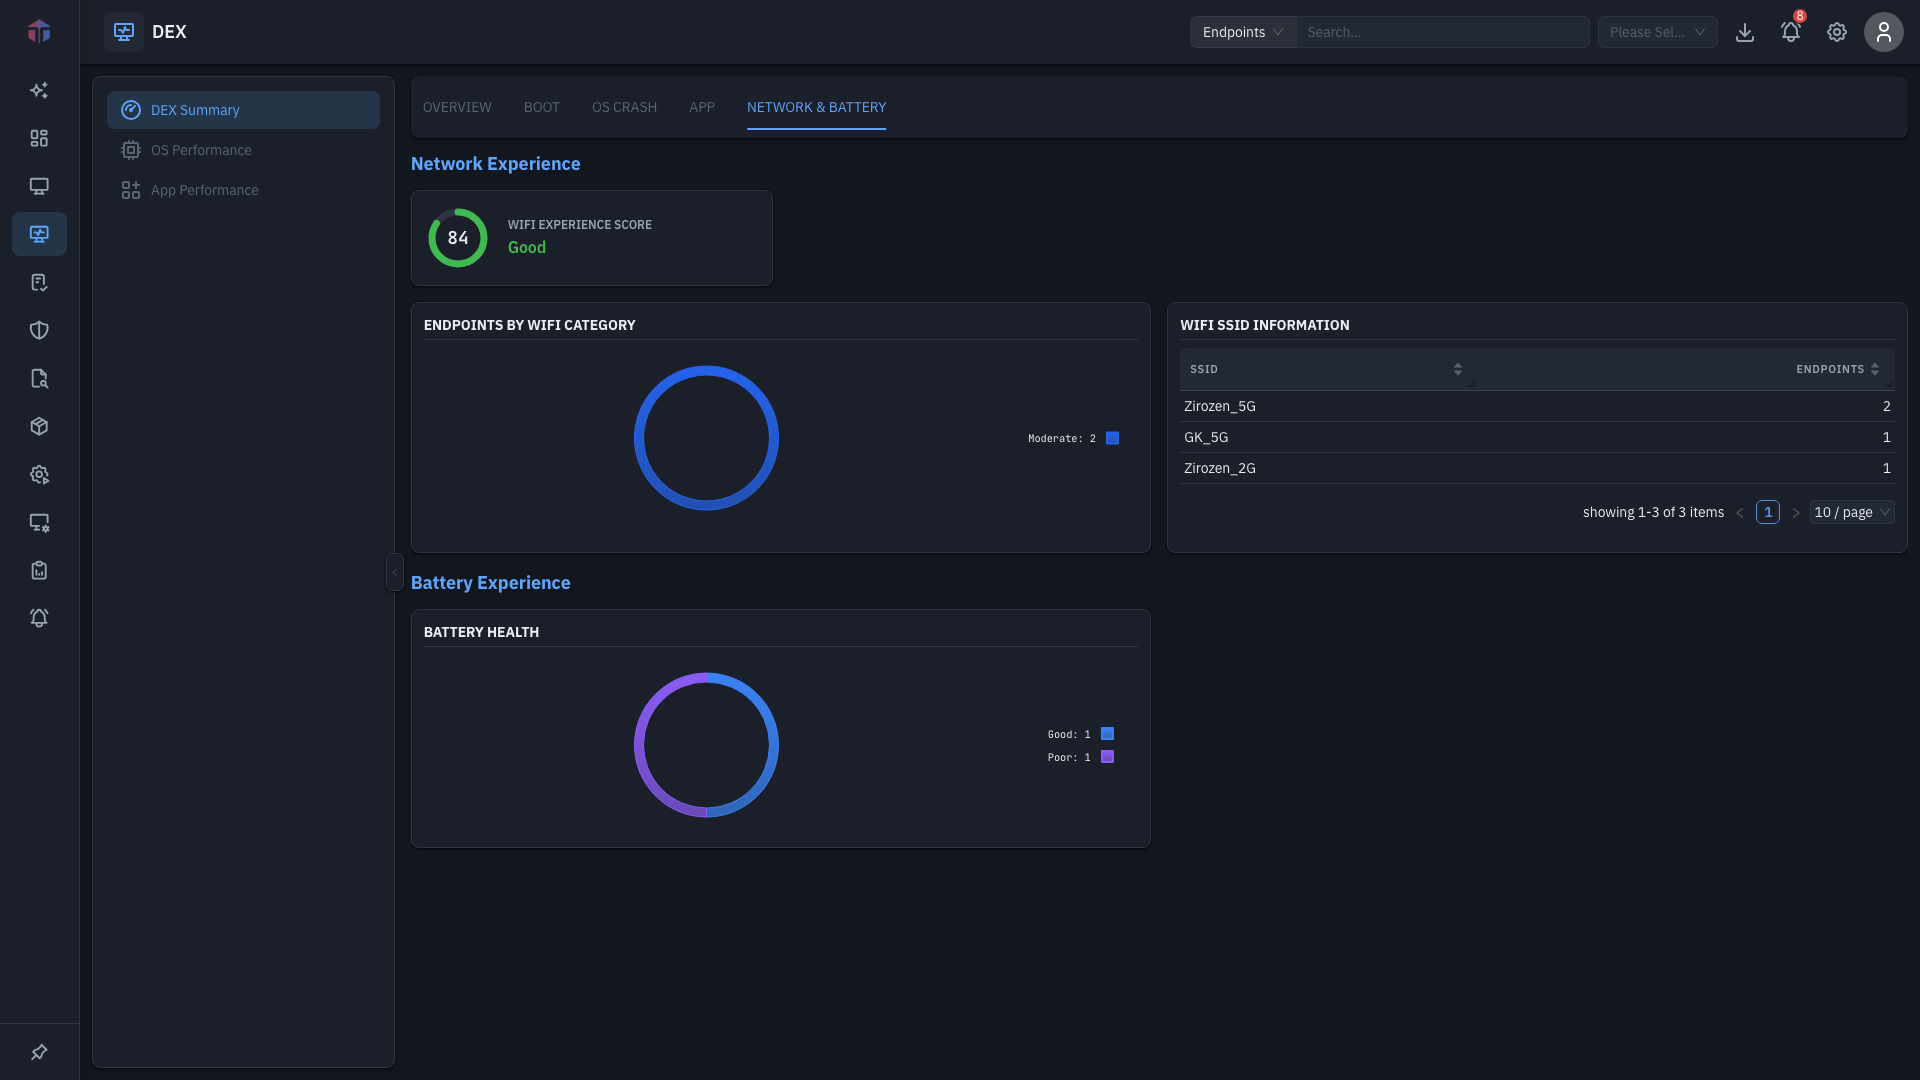
- WiFi Experience Score tile, Endpoints by WiFi Category chart, and a WiFi SSID Information table (SSID + Endpoints).
- Battery Health- machines by battery-health category.
Drill-down: endpoints behind a category
Every category chart (DEX score, Boot, WiFi, Battery) and the WiFi SSID rows are clickable. Click a slice/bar (or an SSID row) to open a modal listing the endpoints in that category.
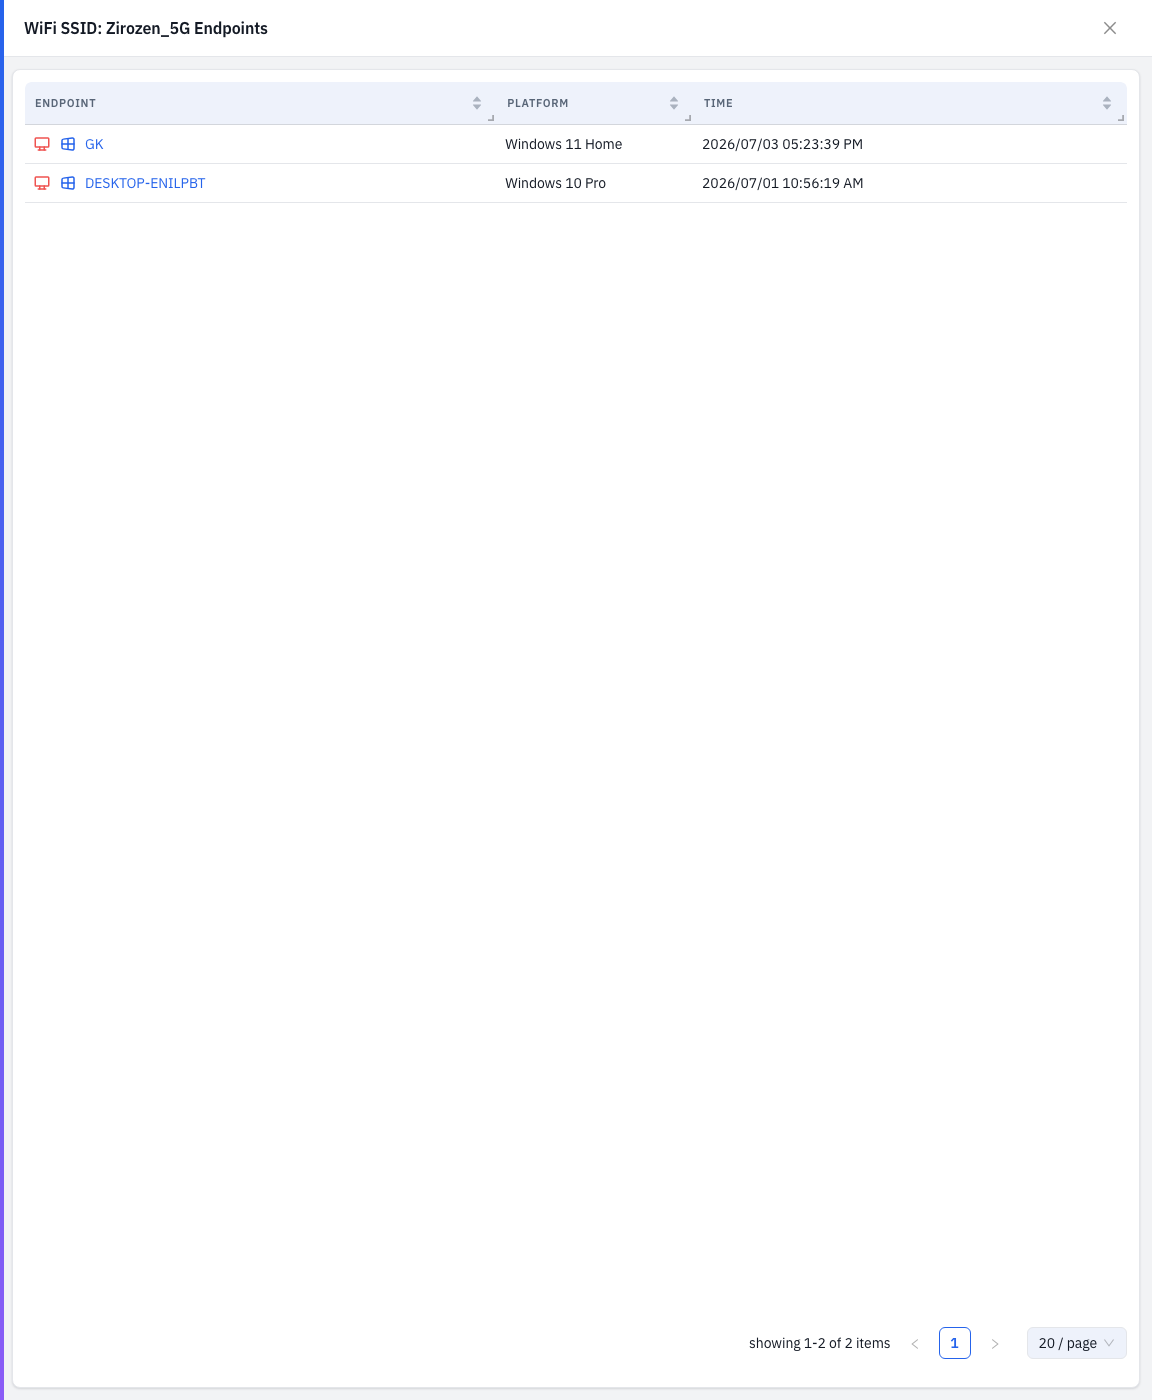
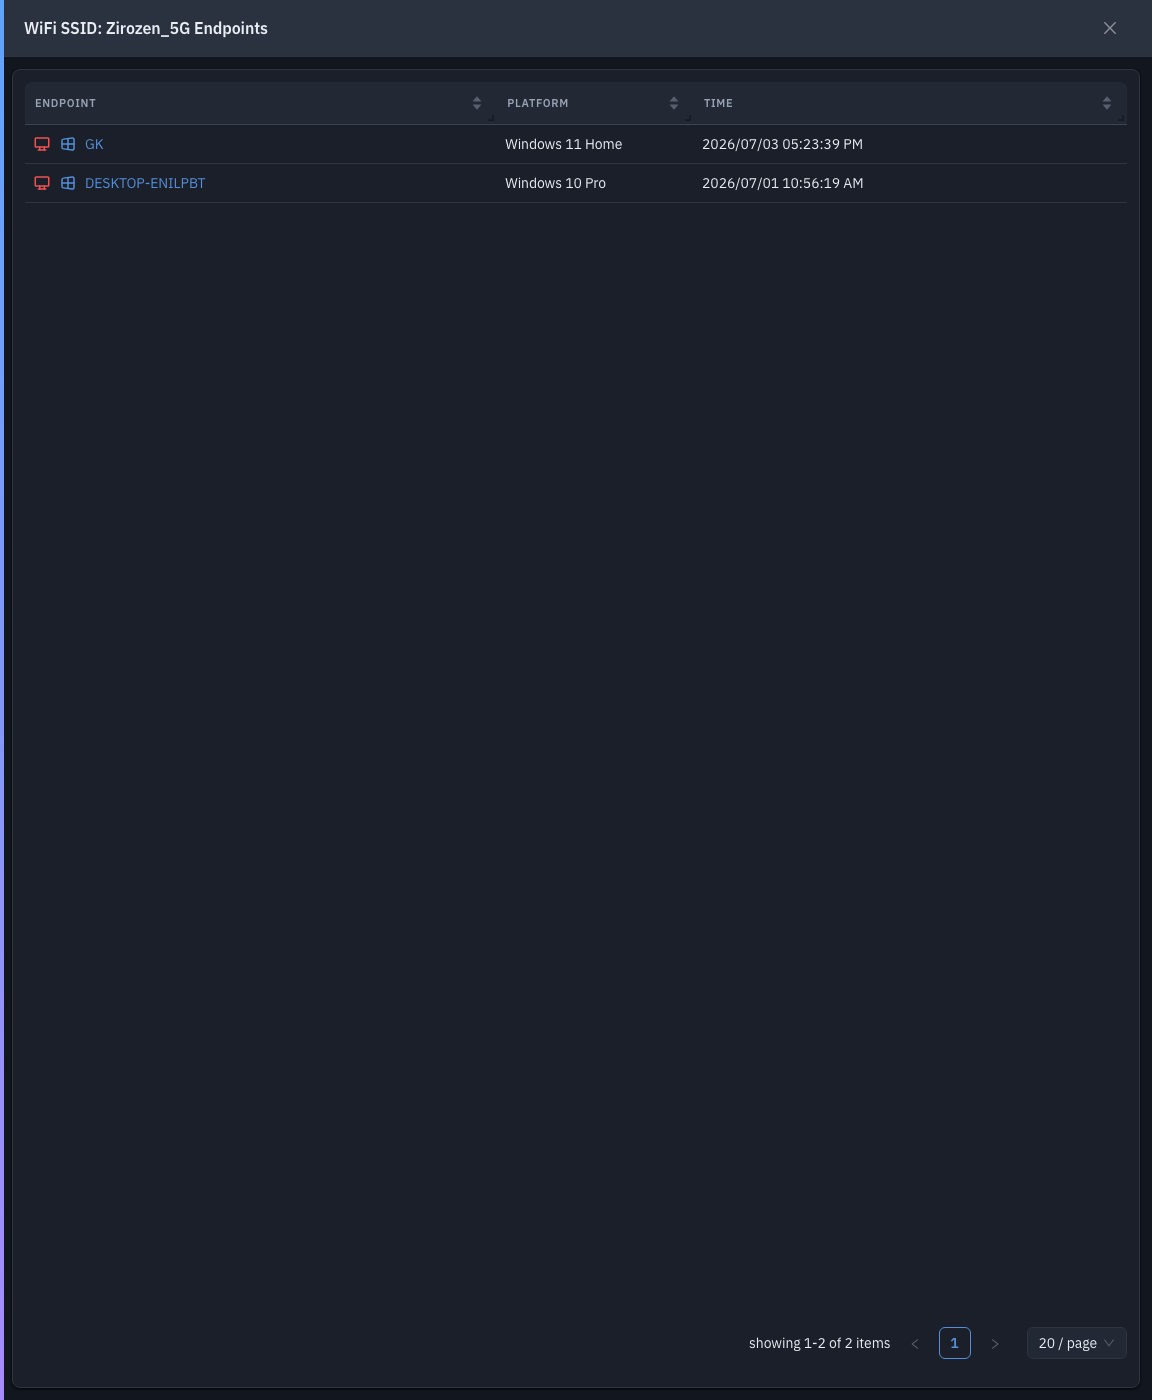
Each endpoint links to its detail page, so you go straight from "which machines have a poor score" to fixing one.
Tips & troubleshooting
- Scores look empty. DEX needs endpoints reporting experience telemetry- give newly enrolled machines time to report, and confirm the agent is online.
- The module is missing. DEX requires the EndpointOps edition.
Related
- OS Performance- boot and OS-crash detail.
- App Performance- app crash, hang, and slow-launch detail.
- Endpoints- each machine's own DEX insight is on its Summary.