Summary
Summary is the home view of a single endpoint- the one-screen health dashboard you land on when you open a machine from the Endpoints list. It rolls up the machine's risk, experience, vulnerabilities, patches, compliance, and more.
This page also covers the parts shared by every tab- how to open the screen, the tab bar, the information ribbon, the quick actions menu, and the Endpoint Vital panel. Each tab has its own page (see the list below).
How to get here
You need View Inventory permission.
- Open Inventory → Endpoints (see Endpoints).
- Click an endpoint's Host Name.
Navigate to: Inventory → Endpoints → (a host name)
URL path: /inventory/endpoints/{id} (for example,
https://your-endpointops-site/inventory/endpoints/1). Deep-link a tab with ?tab=,
e.g. …/inventory/endpoints/1?tab=alert.
The Summary view
When you open an endpoint you land on its Summary- a one-screen health dashboard.
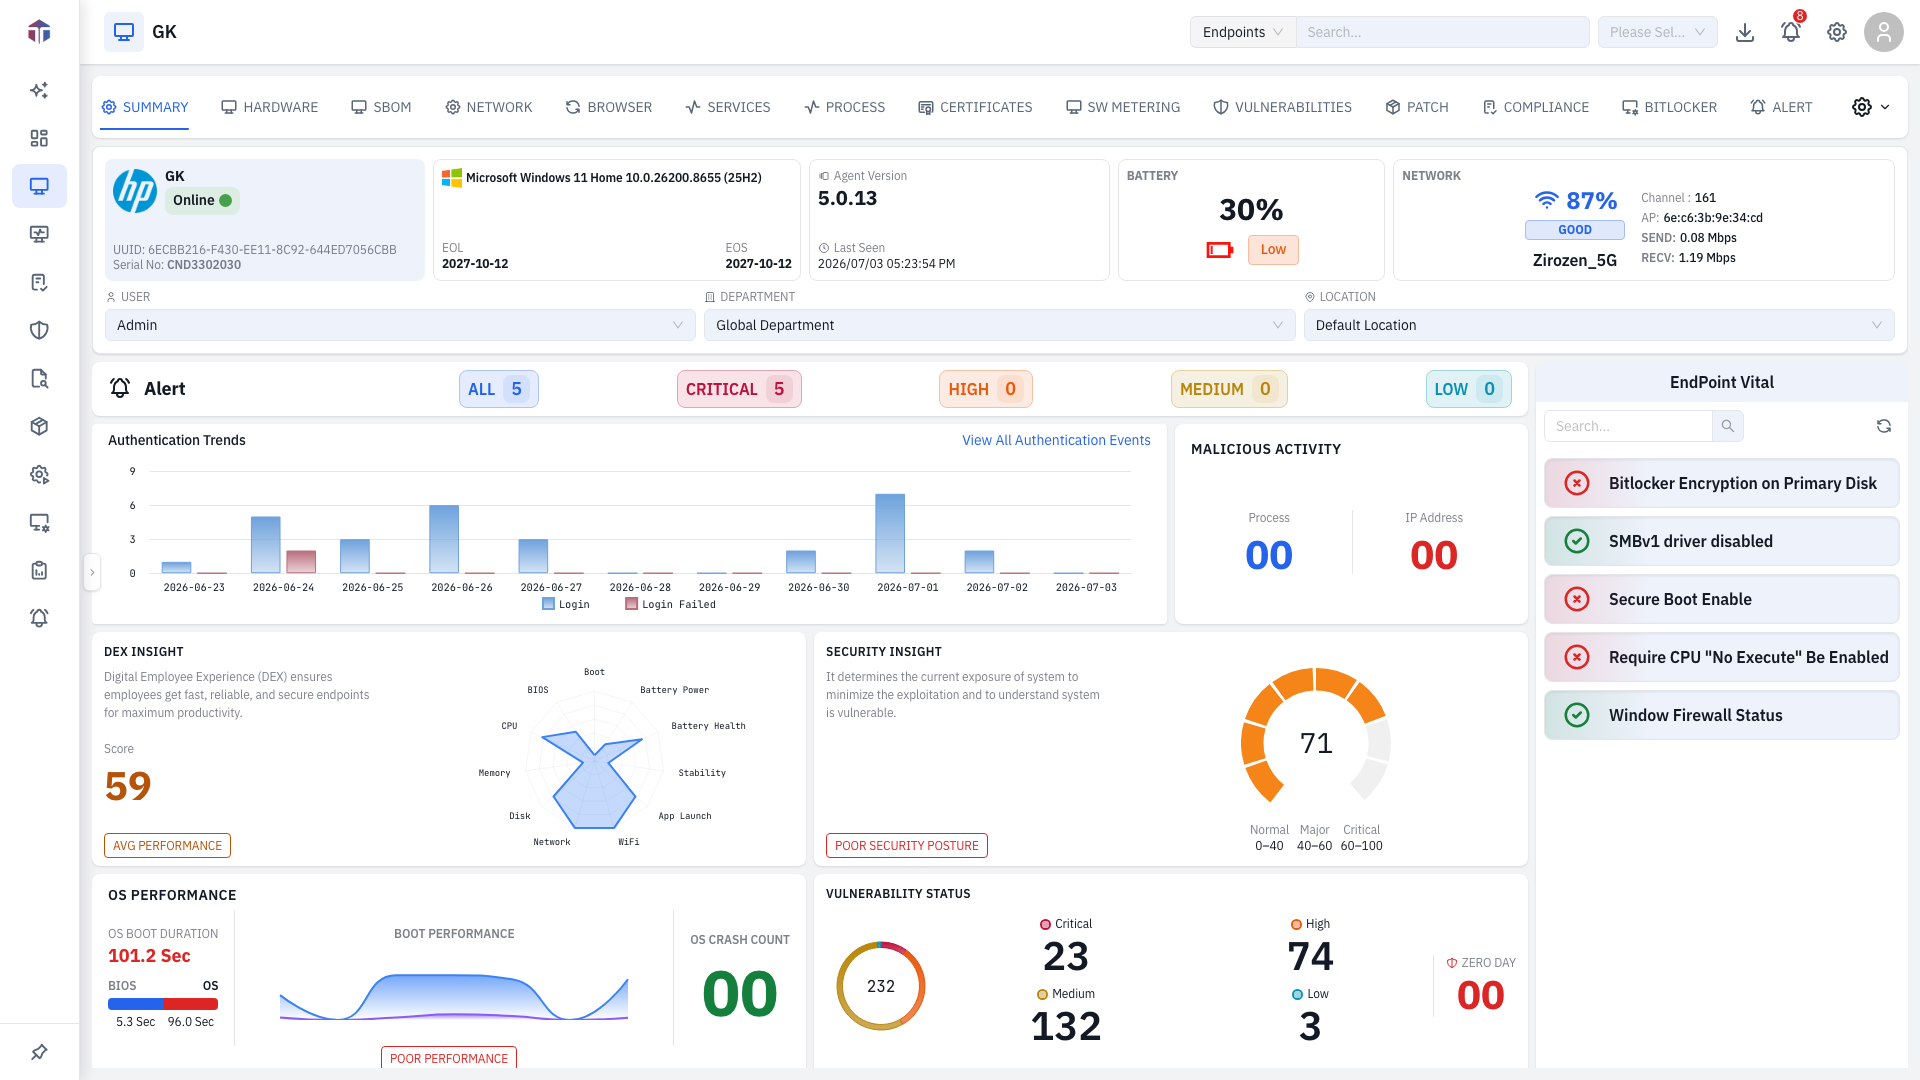
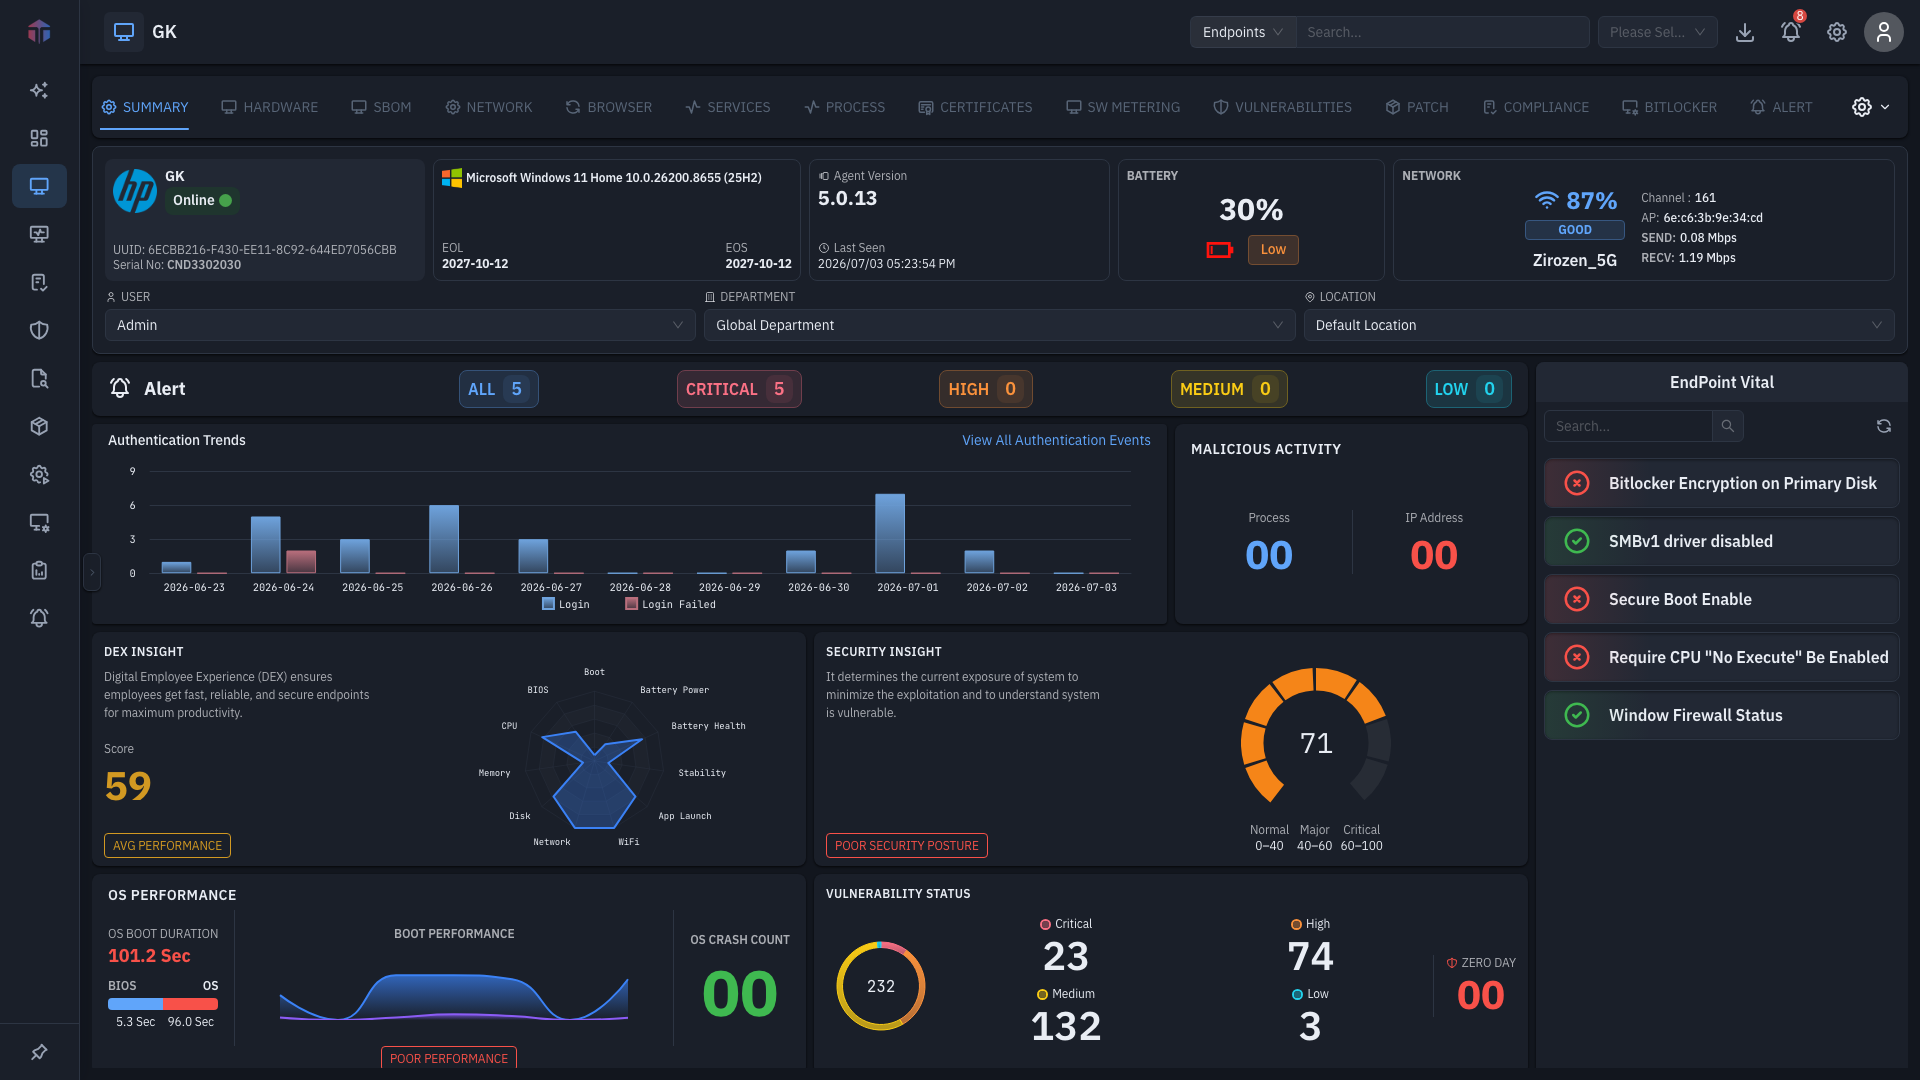
The title shows the host name and an online/offline indicator. Below it, the tab bar switches views, and the quick actions menu (gear, far right) runs remote operations.
Summary collects, as cards:
- Security insight- the endpoint's overall risk score.
- DEX insight- a digital-experience score across boot, app launch, stability, battery, and more.
- OS performance- boot duration and crash count over time.
- Vulnerability status- open CVEs by severity, plus zero-day / exploit counts.
- Patch summary- installed, missing, and success rate.
- Compliance summary- rules passed, failed, and not applicable.
- App performance- average app launch time and the slowest apps.
- Authentication trends and malicious activity (process and IP counts).
- Startup Items, Logged In Users, and System Users tables at the bottom.
- The Endpoint Vital panel down the right side (see below).
The information ribbon
On every tab except Summary, a ribbon at the top shows the endpoint's identity:
| Field | Meaning |
|---|---|
| Hardware Vendor | Make and model of the machine. |
| OS | Operating system name and version. |
| Agent Version | Version of the EndpointOps agent installed. |
| Last Seen | When the agent last checked in. |
| Host Name | The machine name. |
| User | The assigned owner. |
| Department | The endpoint's department. |
| Location | The endpoint's location. |
Endpoint Vital
The Endpoint Vital panel (right side of the Summary) is a live list of quick health checks- disk encryption, firewall, secure boot, "no-execute" CPU protection, and similar. Each shows a status:
- Enabled / pass- the check is satisfied.
- Disabled / fail- the check is not satisfied (needs attention).
- Unknown- the agent couldn't determine it (often because the endpoint is offline).
The panel refreshes on its own every few seconds. Which checks appear is set by your administrator under Settings → Policy Management → Endpoint Vital.
Quick actions
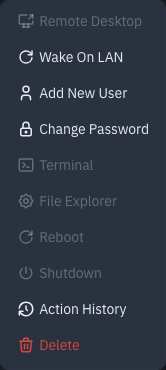
The actions menu (the gear at the far right of the tab row) runs operations on the real machine.
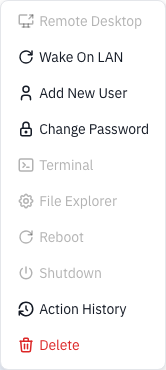
| Action | What it does | Notes |
|---|---|---|
| Remote Desktop | Opens a remote desktop session. | Online only. Needs Remote Desktop permission. |
| Wake On LAN | Powers the machine on. | |
| Add New User | Creates a local account. | |
| Change Password | Changes a local account password. | |
| Terminal | Opens a remote shell. | Online only. |
| File Explorer | Browses the machine's files. | Online only. |
| Reboot | Restarts the machine. | Online only. Asks you to confirm. |
| Shutdown | Powers the machine off. | Online only. Asks you to confirm. |
| Action History | Opens a drawer of past remote actions with status. | |
| Delete | Removes the endpoint from EndpointOps. | Asks you to confirm. |
Each action appears only if your role grants it.
Reboot, Shutdown, and Delete ask for confirmation because they affect the real endpoint or its record. Online-only actions are disabled while the machine is offline (red indicator).
Action History
Action History opens a drawer listing past remote actions for this endpoint: Id, Action, Status (Waiting, In Progress, Success, Failed, …), Created By, and Created On. Click a completed action to see its full result.
The tabs
Each tab has its own page:
| Tab | What it shows |
|---|---|
| Hardware | Full hardware inventory across 16 sub-sections. |
| SBOM | Software bill of materials- installed packages. |
| Network | Network interfaces and listening ports. |
| Browser | Installed browsers, by family. |
| Services | Installed services, start/stop. |
| Process | Running processes and remote connections. |
| Certificates | Installed certificates. |
| SW Metering | Software usage metering. |
| Vulnerabilities | CVEs affecting this endpoint. |
| Patch | Missing, installed, and excepted patches. |
| Compliance | Compliance framework results. |
| BitLocker | Disk-encryption status and recovery keys. |
| Alert | Security and policy alerts for this endpoint. |
The tabs available depend on your product edition and your role's permissions. This guide documents the full set; your environment may show fewer.
Tips & troubleshooting
- A tab is missing. Tabs are gated by edition and permissions- Vulnerabilities, Compliance, BitLocker, and others require the matching license.
- Quick actions are greyed out. Remote Desktop, Terminal, File Explorer, Reboot, and Shutdown only work while the endpoint is online.
- Data looks stale. The agent reports on a schedule and only when online- Last Seen in the ribbon tells you how fresh it is.
Related
- Endpoints- the list you open this screen from.
- Enrolling an Endpoint- how a machine gets here.
- Alerts- the fleet-wide alerts view.
- Vulnerabilities- the fleet-wide module behind the CVEs this summary surfaces per endpoint.
- Patches- the fleet-wide patch module behind the missing/installed patch counts shown here.
- Compliance- the framework results this summary rolls up for the endpoint.
- DEX Summary- the fleet-wide digital-experience view the endpoint's experience score feeds.