Reports
Reports is a custom report builder. You assemble a report from widgets (the same charts, grids, and gauges you use on the Dashboard), preview it live, and then download it as PDF or XLSX- or schedule it to be generated and emailed on a recurring basis.
How to get here
You need View Report permission.
- In the left sidebar, click Reports.
Navigate to: Reports
URL path: /reports (opens the report list at /reports/list)
The Reports screen
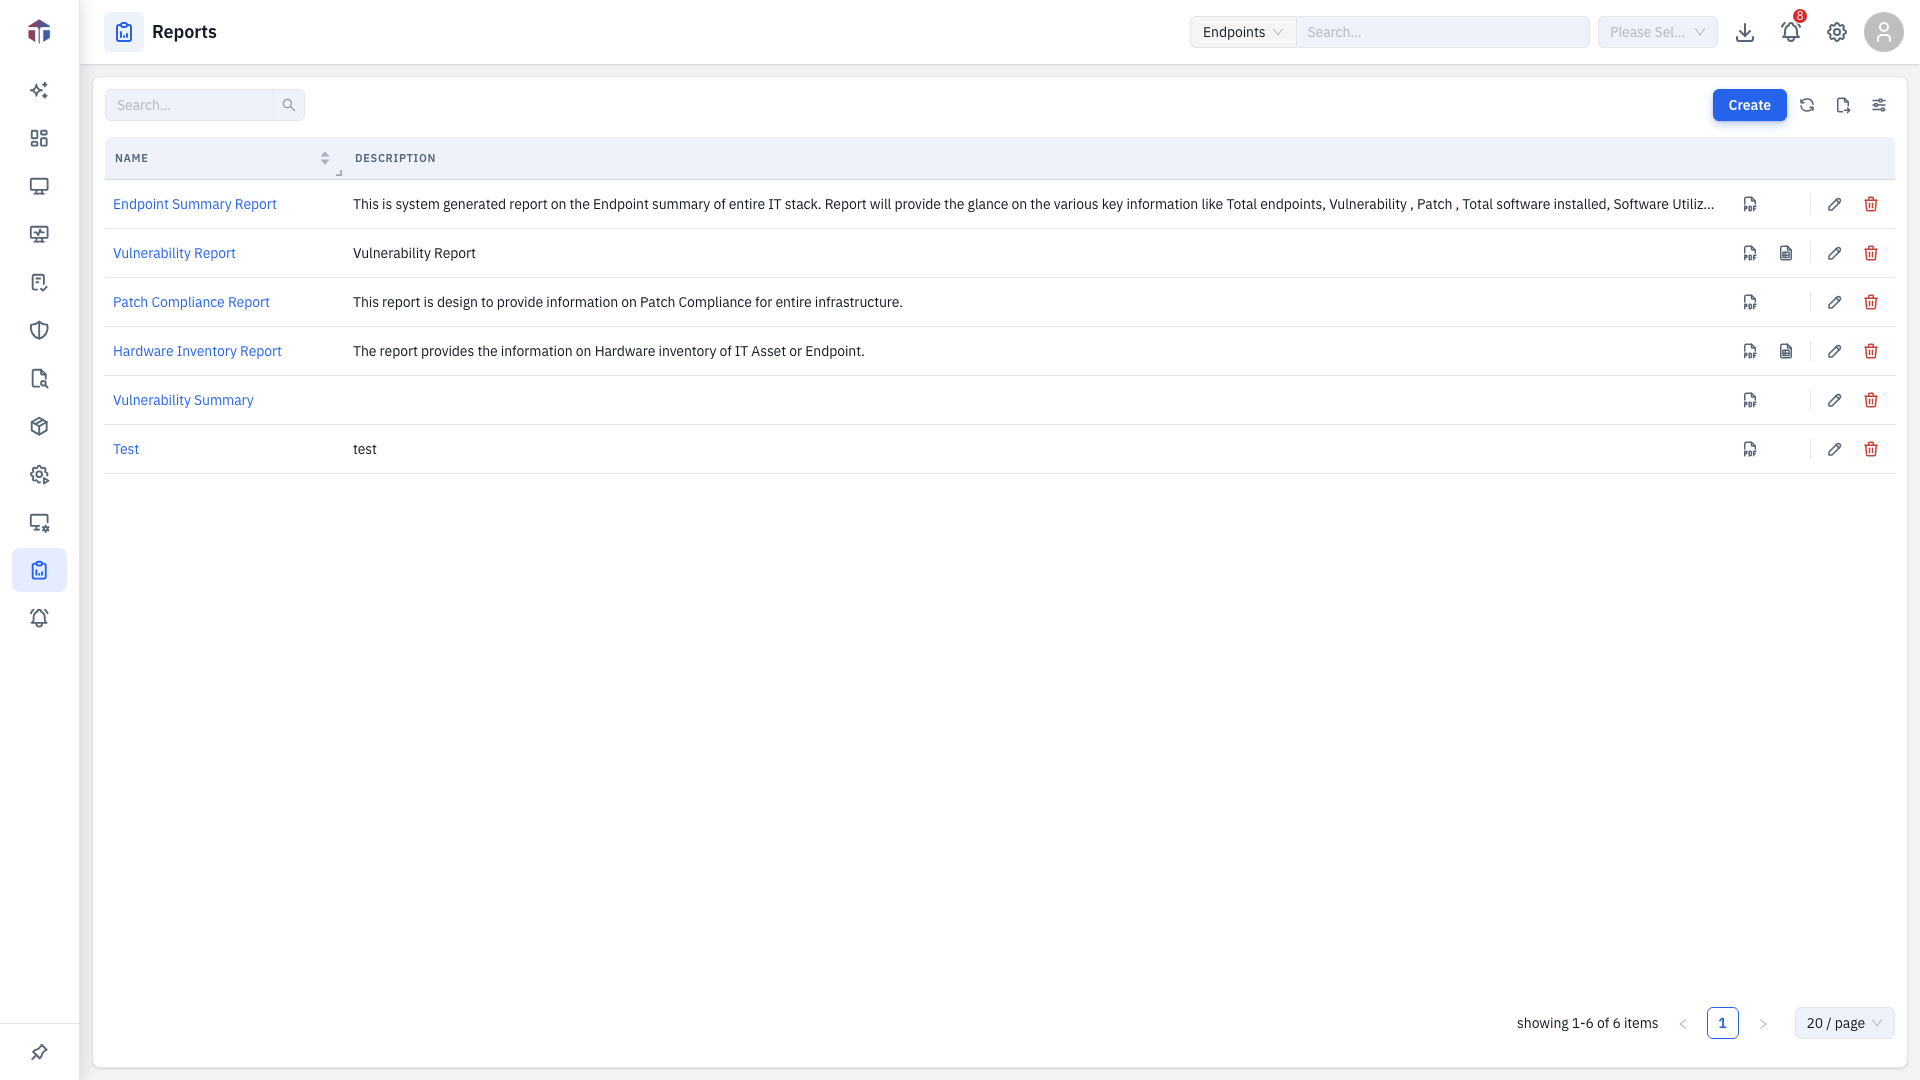
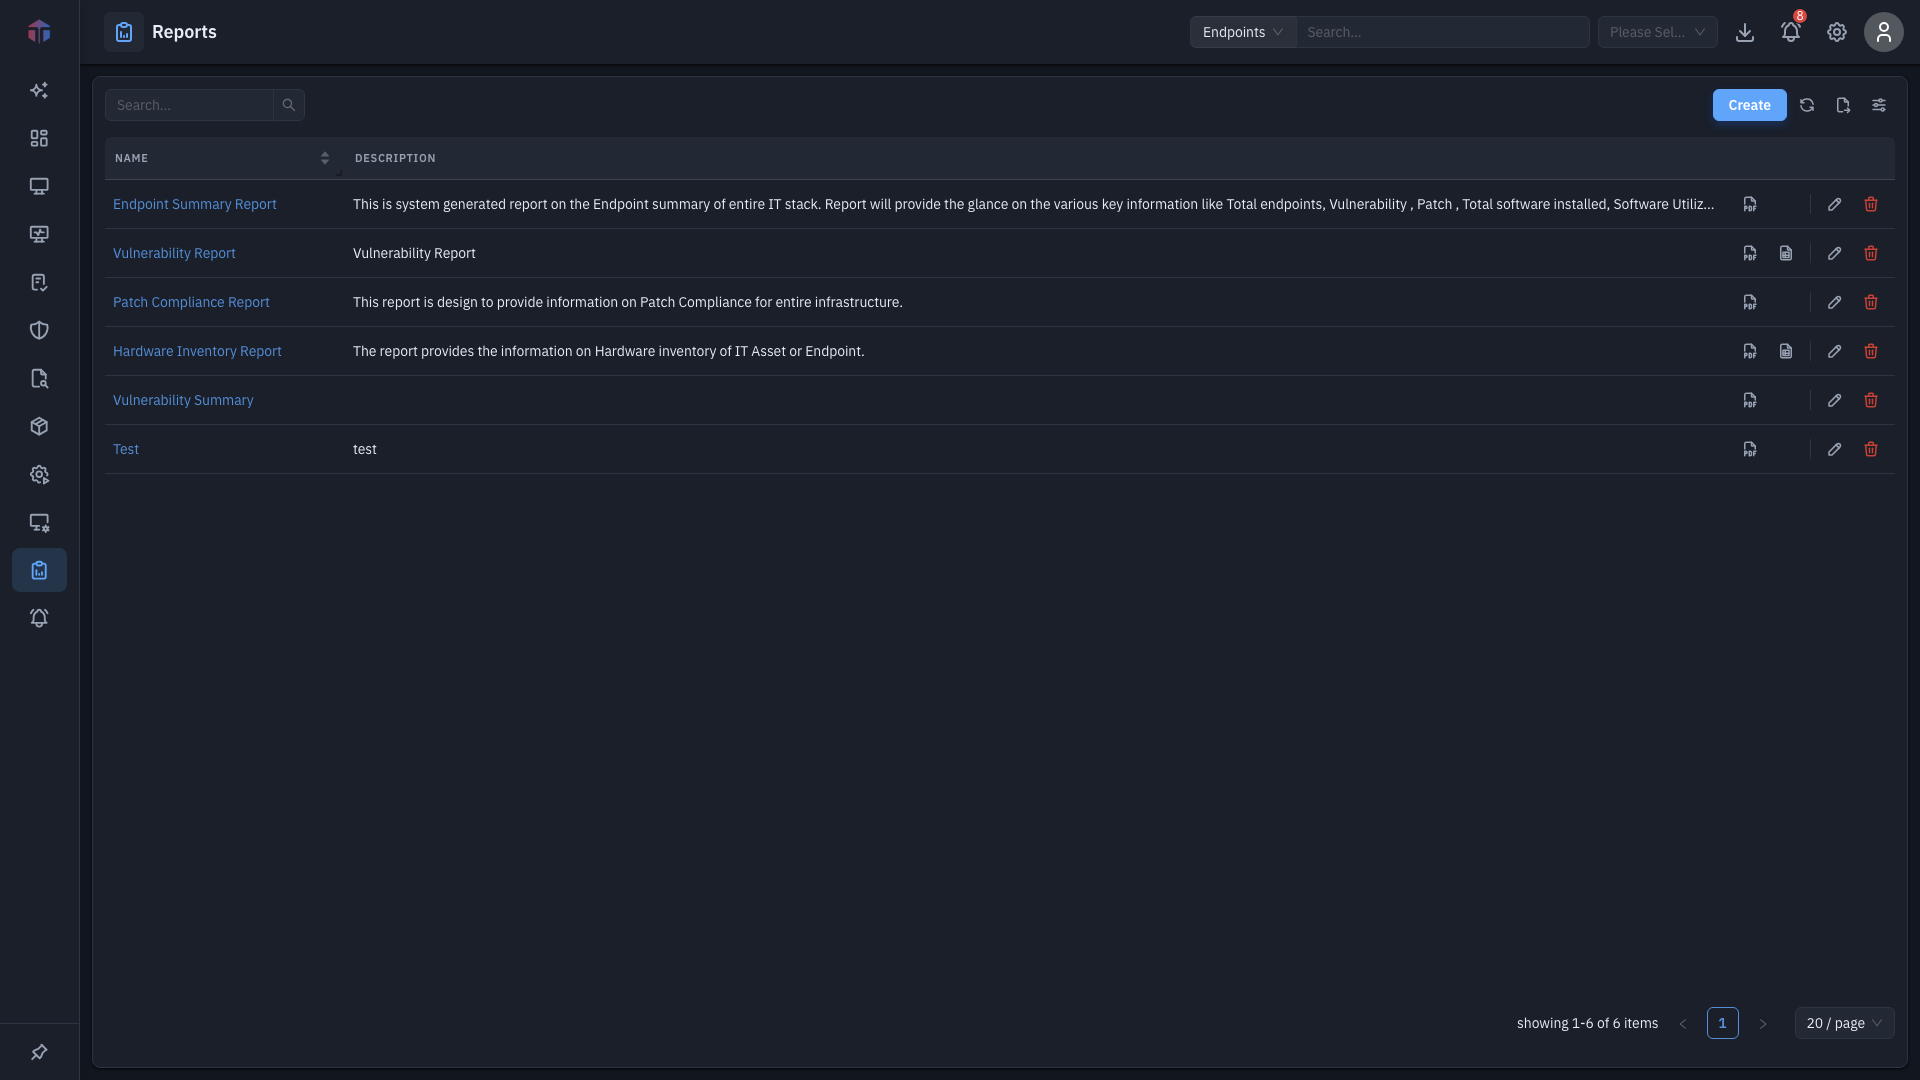
| Column | What it shows |
|---|---|
| Name | The report- click it to open (read-only). |
| Description | What the report covers. |
| Download | A PDF button (always) and an XLSX button (only when every widget is a Grid). A progress ring shows while a download is being generated. |
| Created By / Created On | Who created it and when. |
Toolbar: Create a report, and Search by name, description, or type. Row actions: Edit (pencil) and Delete.
How do I create a report?
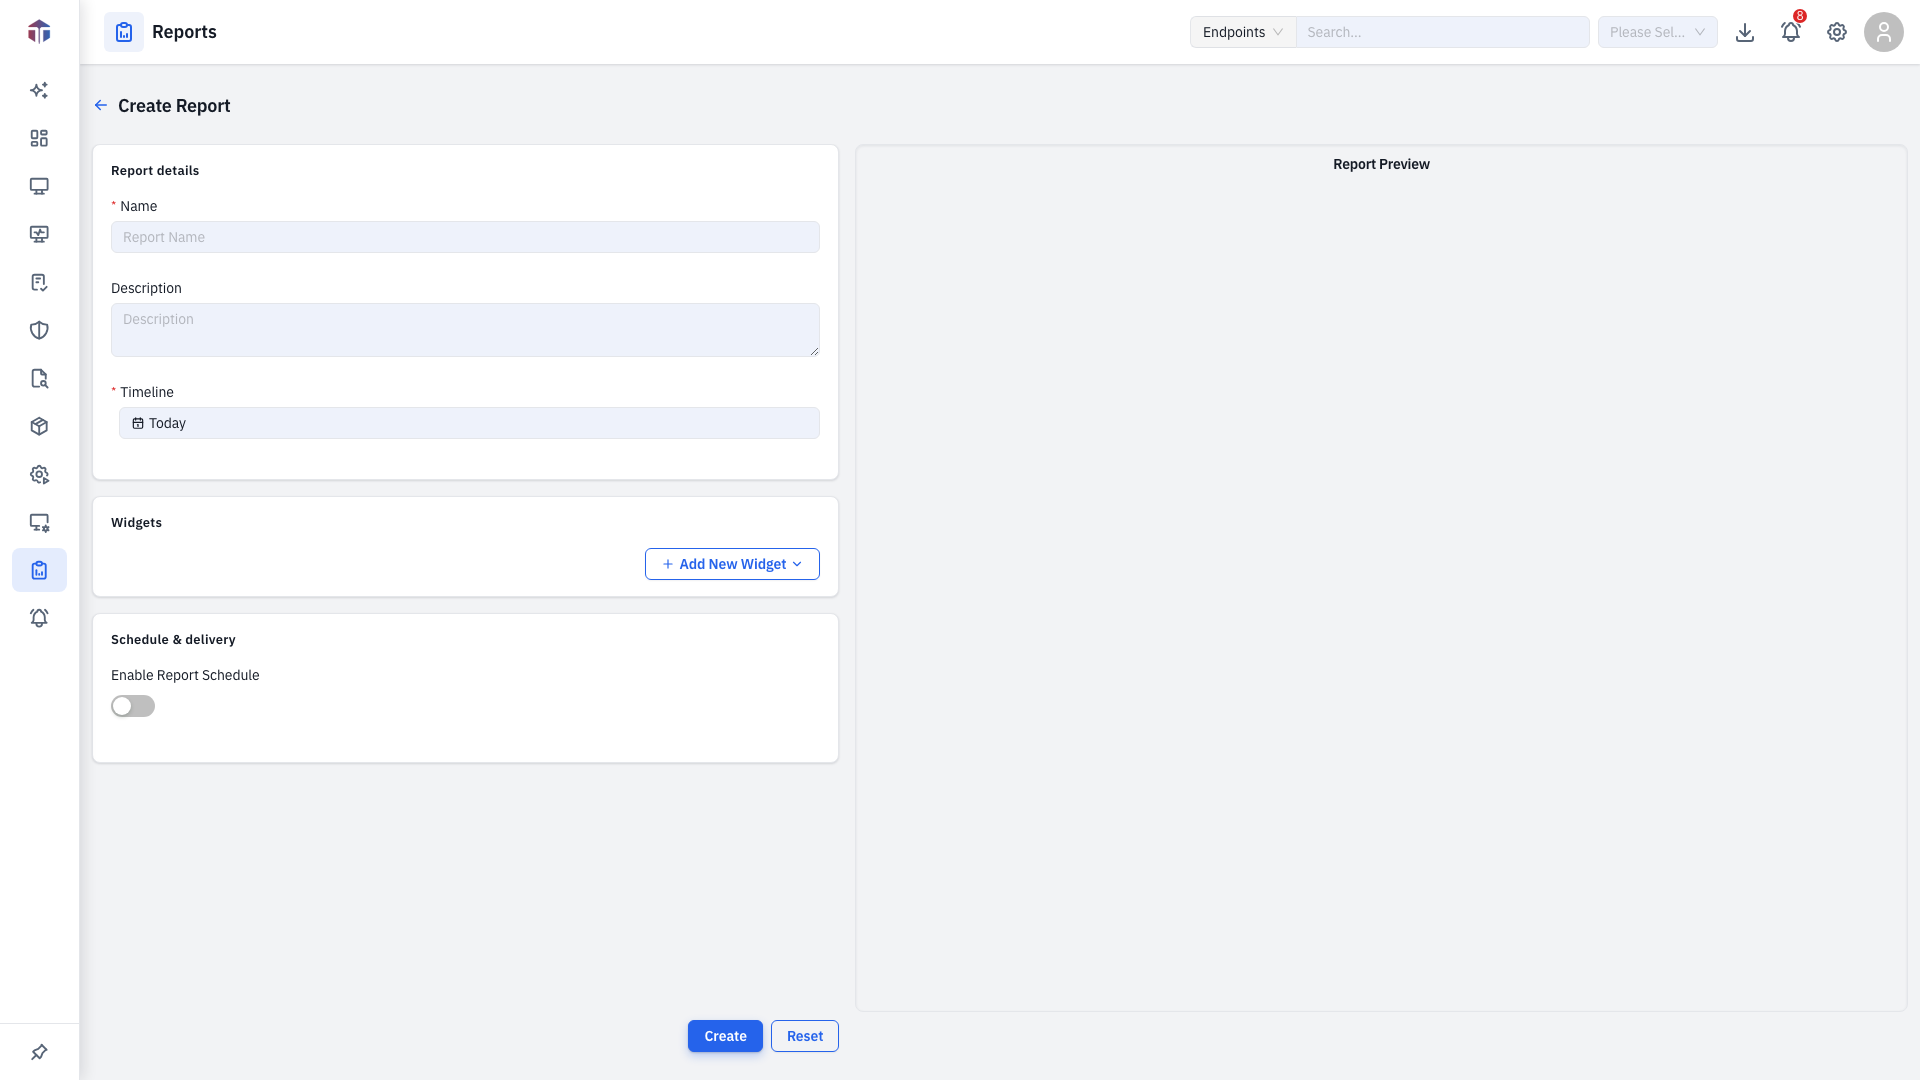
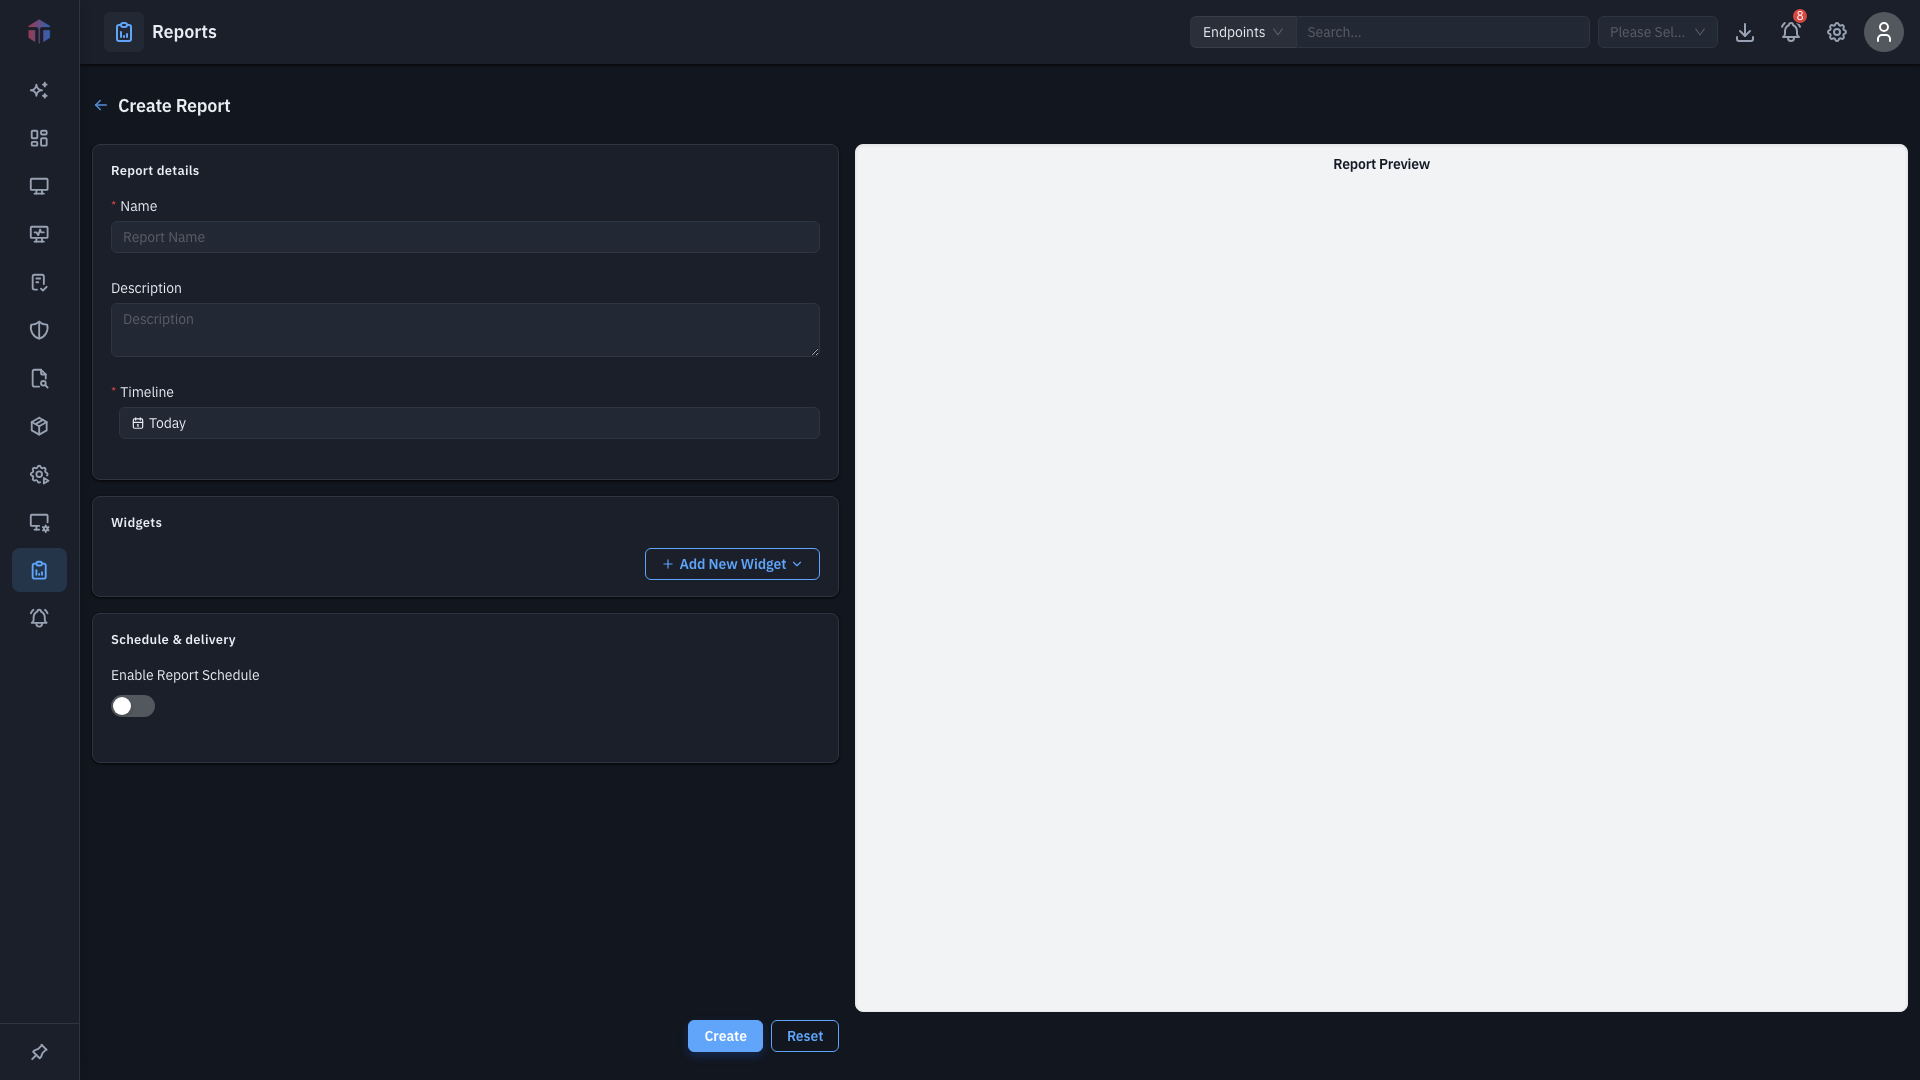
Click Create. The builder opens with a form on the left and a live Report Preview on the right. (Editing an existing report opens the same builder- the screenshot below shows a report with several widgets already added and previewing live data.)
| Field | Required | Notes |
|---|---|---|
| Name | Yes | The report's title. |
| Description | No | What it covers. |
| Timeline | Yes | The time range all widgets report on (Today, This Week, This Month, Previous Month, and so on). |
| Add New Widget | Yes (≥1) | Add a widget- Create New (build one inline) or Choose Existing Widget (pick a saved dashboard widget). |
| Enable Report Schedule | No | Turn on to email the report automatically (reveals the scheduling fields below). |
When scheduling is on:
| Field | Required | Notes |
|---|---|---|
| Export Type | Yes | PDF or XLSX (XLSX only when all widgets are Grids). |
| Schedule | Yes | Every Hour, Every Day, Every Week, Every Month, or a Cron Expression. |
| Job Time | Yes* | Time of day to run (for hourly–monthly schedules). |
| Job Day | Yes* | Day to run (Every Week / Every Month). |
| Cron Expression | Yes* | A cron string, when the schedule type is Cron. |
| Delivery | Yes | Email. |
| Recipients | Yes | Who receives the report. |
Add the widgets (below) before you click Create to save- a report needs at least one.
How do I add widgets to a report?
Widgets are the heart of a report- each chart, grid, or gauge is one widget, the same building block used on the Dashboard. You add them two ways.
Click Add New Widget. A menu offers both options:
Choose an existing widget
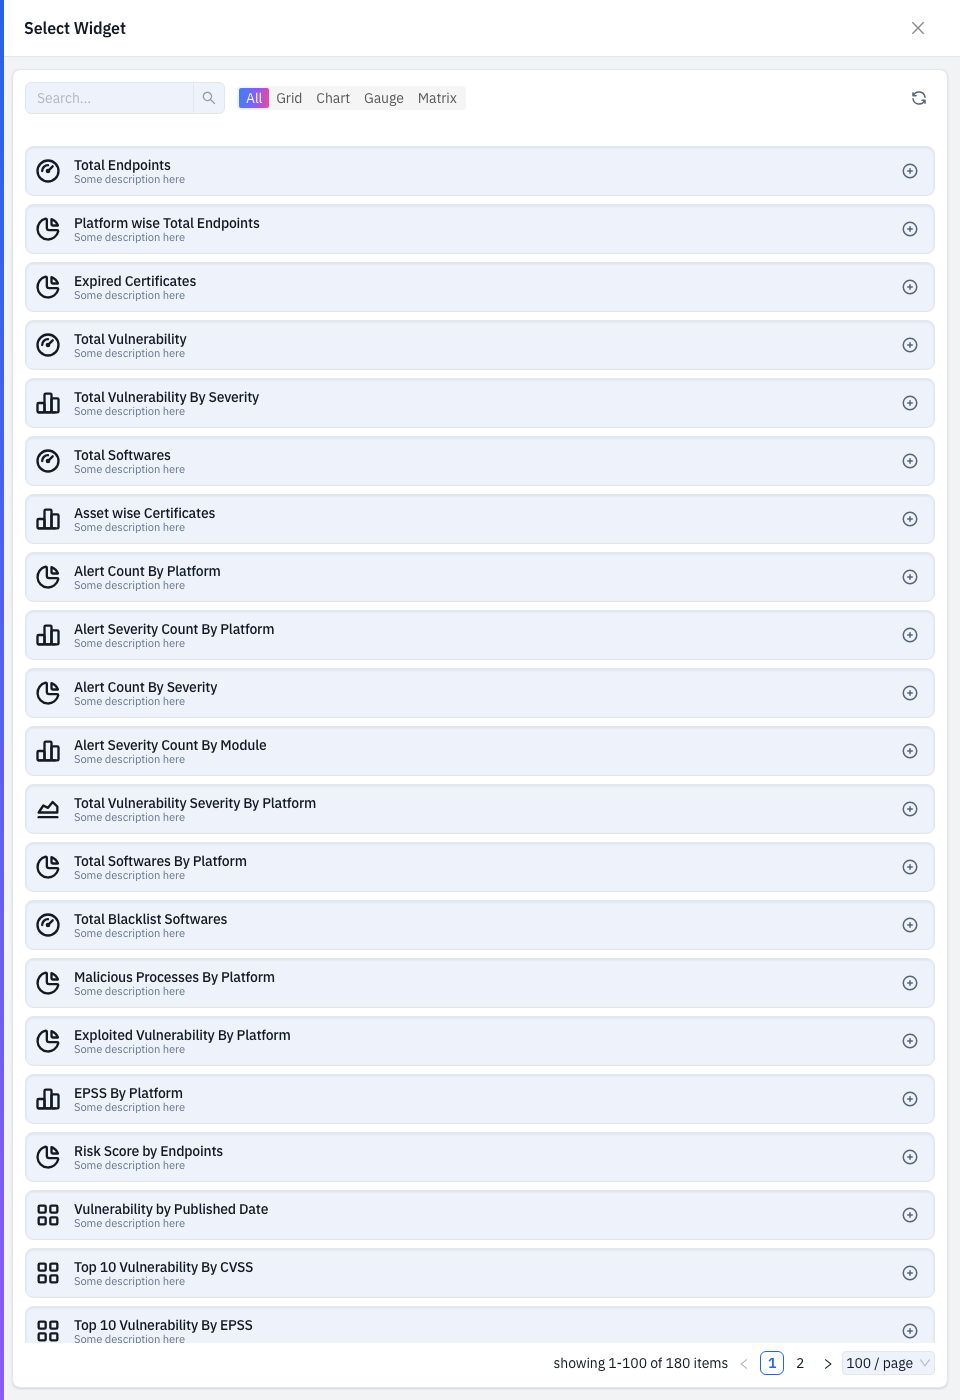
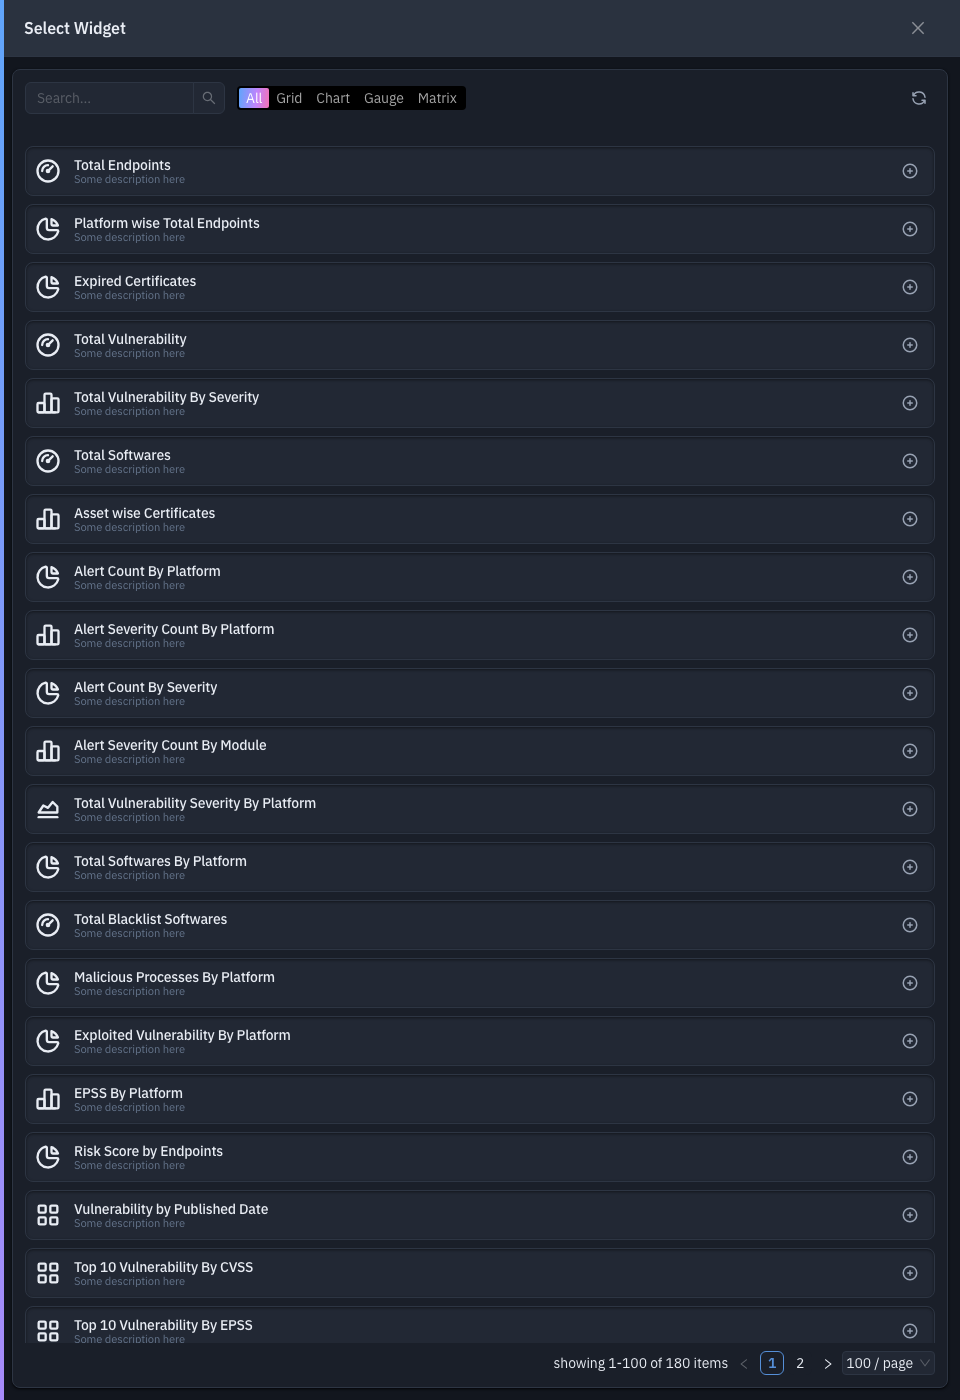
Pick Choose Existing Widget to reuse a widget you've already built. A picker of your saved widgets opens; click one to add it to the report.
Create a new widget
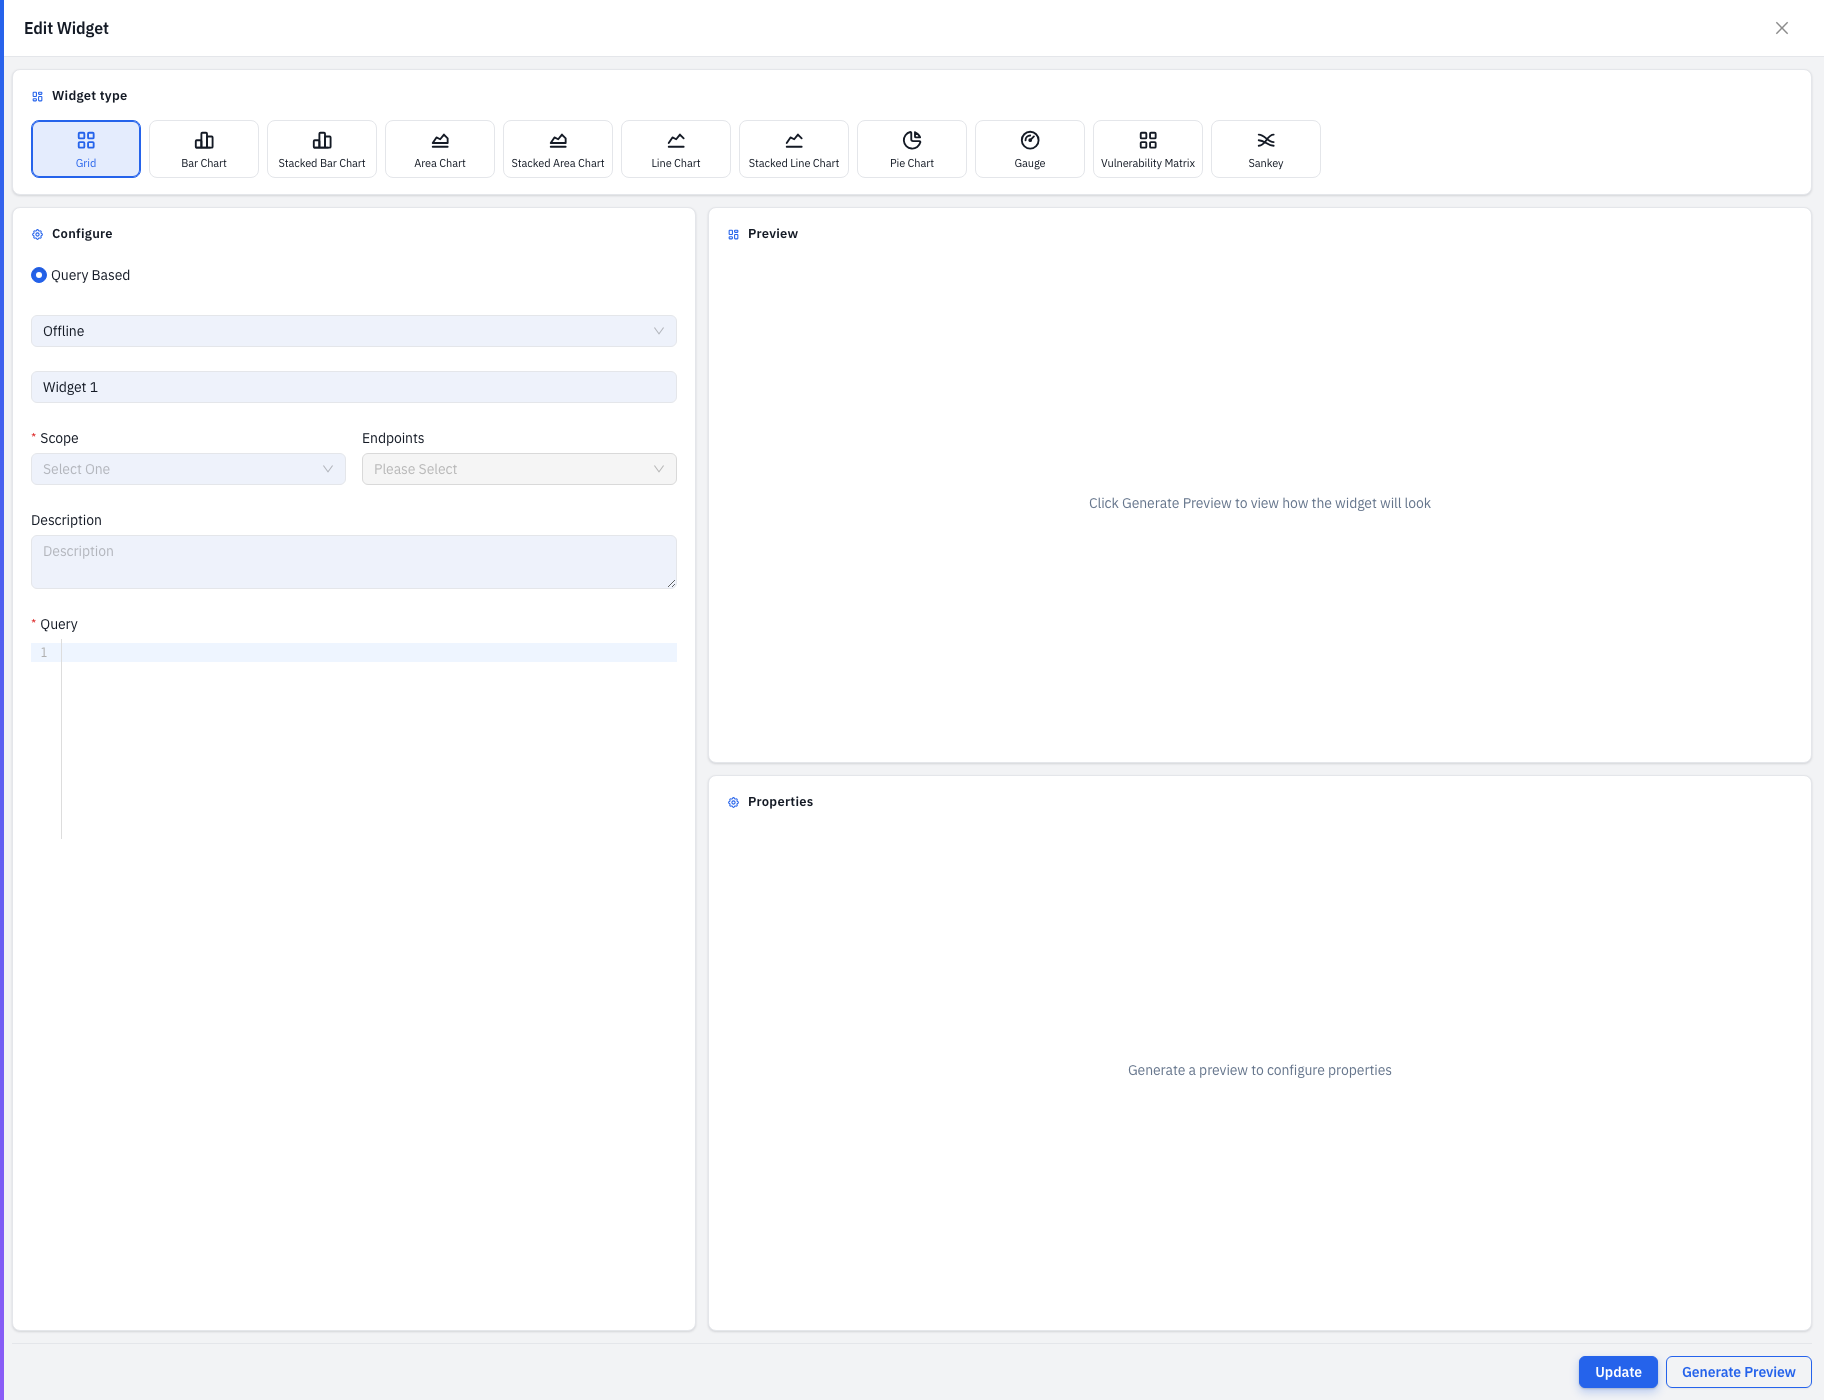
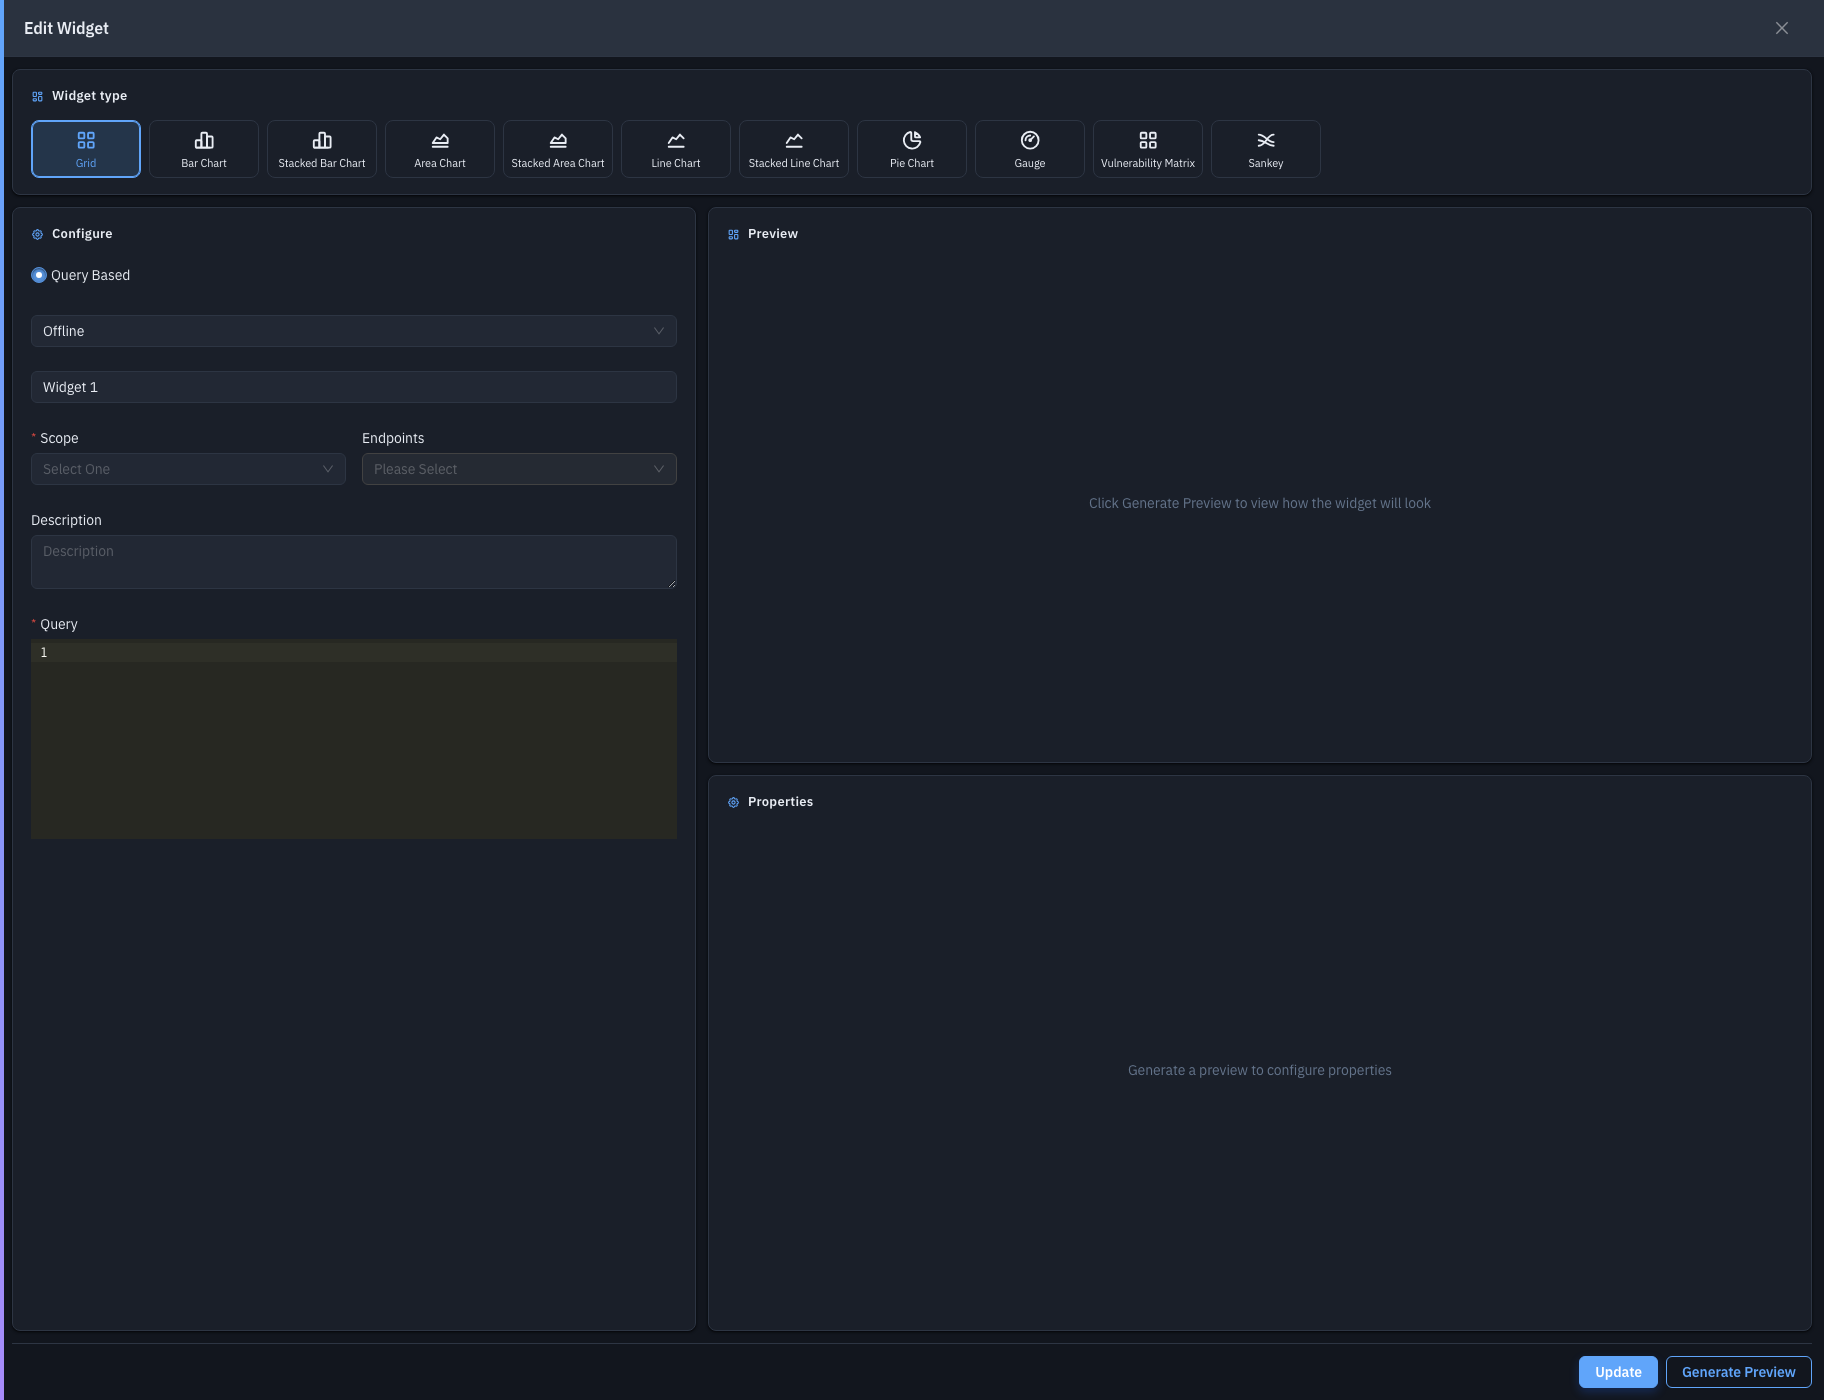
Pick Create New to build one inline. This opens the widget builder- the same form-plus-live-preview editor used on the Dashboard: choose a type (Grid, Bar, Line, Pie, Gauge, Sankey, …), name it, write the query, set the axes, and style it. See Dashboard → adding or editing a widget for the full field-by-field reference.
A widget inside a report uses the report's Timeline, not its own- so every widget reports over the same period.
Arrange the report
Each widget you add shows in the left-hand list with edit (pencil) and remove (×) controls. In the Report Preview on the right, drag a widget to move it and drag a corner to resize it (Grids span the full width; charts take about half). The preview renders live data, so you see the finished report as you build it. Click Create to save.
How do I download a report?
On the list, click PDF (or XLSX) in the Download column. Generation runs in the background- you'll see a progress ring, and the file downloads automatically when it's ready.
The XLSX button only appears for reports whose widgets are all Grids- chart widgets can't be represented as spreadsheet rows.
Tips & troubleshooting
- I can't save the report. A report needs a Name, a Timeline, and at least one widget.
- No XLSX option. The report contains a chart/gauge widget- only Grid-only reports export to XLSX. Use PDF, or swap to Grid widgets.
- A scheduled report didn't arrive. Check the Recipients and that your Mail Server is configured under Settings → System Settings → Mail Server.
Related
- Dashboard- the same widgets, shown live instead of exported.
- Mail Server Configurations- needed for scheduled email delivery.